


ASSET MANAGEMENT: By Tony McGrail
Condition monitoring can provide valuable warnings about transformer health, including identification of deterioration, change in operational state, and impending failure. This article looks at two straightforward condition monitoring applications which resulted in expected results in one case and unexpected results in the other.
Introduction: Why are we here?
Condition monitoring can provide valuable warnings about transformer health, including identification of deterioration, change in operational state, and impending failure. To realize the potential of condition monitoring, we need to understand what it actually measured, how that measurement relates to failure modes which may apply and determine how to act on that information. This article looks at two straightforward condition monitoring applications which resulted in expected results in one case and unexpected results in the other.
A simple analogy for condition monitoring is a car tire pressure warning light: it can tell you that the pressure has fallen below a certain level and may even tell you what the pressure is, but it doesn’t tell you why the pressure has fallen – so we are detecting a possible problem rather than diagnosing a problem. And we do need to remember that it is a possible problem, as the sensor itself may be at fault: if the tire pressure is indicated to be negative, say, we may suspect a problem with the sensor and monitor.
With a car tire, we have the tire specification and manufacturer’s recommendations, so we know what the pressure should be: we have expectations. We should also have expectations when applying condition monitoring to transformers: what do we expect the top oil temperature to be under certain load/ambient conditions? What about dissolved gas analysis – how well does the online monitor match lab results? If we know what to expect then we can identify measurements which are unexpected or anomalous and worthy of deeper investigation. (We could get into a whole discussion on false positives and false negatives at this point – but let’s save that for another day.)
Case 1: All according to plan
This case is one where a rise in current was used as an indicator of bushing deterioration; a rise was detected, but the speed with which the deterioration developed was unexpected. In 2012, a monitor was making hourly measurements of leakage current magnitude and phase on two sets of three Trench bushings on a transmission transformer.
Figure 1 shows the leakage current for all 6 bushings over a 24-hour period: HV bushing results overlaying well at about 24.5 mA and the LV set consistently at about 7 mA – in line with calculated values for the system voltage and the individual bushing C1 nameplate values.
There was a sudden rise in the leakage current over two hours, generating a high-level alert. The owners had a response plan which they acted upon, requiring the transformer to be de-energized within two minutes of receiving the alert for offline testing. The plan was followed, the bushing was tested, showing elevated power factor and capacitance, and replaced. The subsequent bushing tear-down confirmed advanced deterioration.
The case is discussed with the original utility in a paper entitled “Condition Monitoring in the Real World” presented at the International Doble Client Conference of 2012 [1].
We should have expectations when applying condition monitoring to transformers. If we know what to expect then we can identify measurements which are unexpected or anomalous and worthy of deeper investigation.
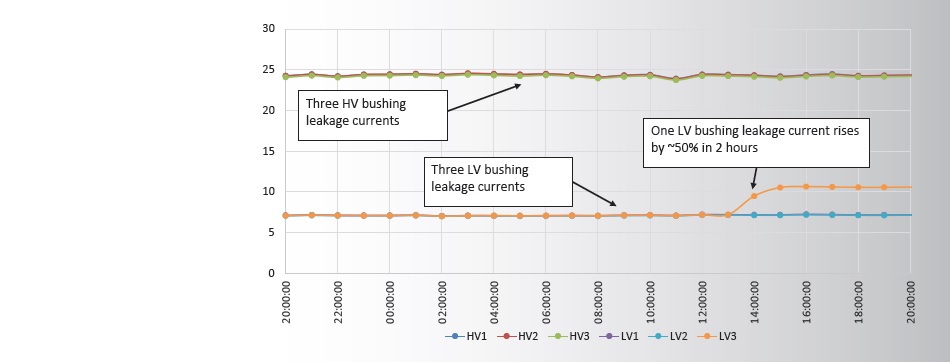
Figure 1. Leakage current magnitude for two bushing sets on a transmission transformer
This case underlines the need for a response plan when applying monitoring, and also the need to learn about relevant failure modes. Unlike GE Type-U bushings which have a known failure mode where deterioration is usually reflected in power factor rise over several weeks to months, for the Trench bushing in this case, the owners thought a catastrophic failure was possible within ‘about five more hours’. Consequently, for such bushings, we now usually recommend monitoring at the 1-5 minute interval level.
Case 2: All according to plan, then there is a change
In this case, a bushing shows a gentle rise in power factor over a period of several weeks, as shown in Figure 2. These results are from a relative power factor analysis of the currents from a set of three tertiary bushings. The rise is unexpected, with the other two bushings showing the expected form of almost constant power factor.
Relative power factor has been successful in detecting and diagnosing bushing issues for over 20 years, using the individual leakage currents from a set of three bushings. However, it is always useful to have a ‘check’ on the results, if possible. In this case a voltage reference was available for each phase, and ‘true power factor’ values were calculated based on the loss angle between the bushing leakage current and the instrument transformer voltage. Figure 3 shows the three relative power factor values, and the three true power factor values: the two gently rising values are from one bushing.
When applying monitoring, there is the need for a response plan and also the need to learn about relevant failure modes.
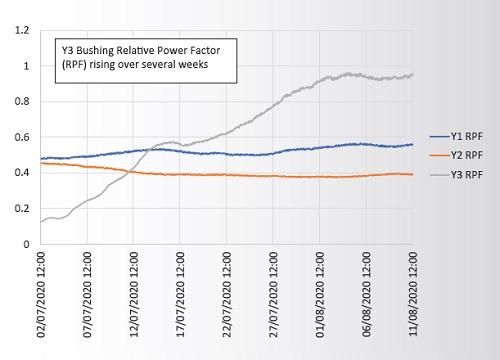
Figure 2. Relative Power Factor for a set of three bushings
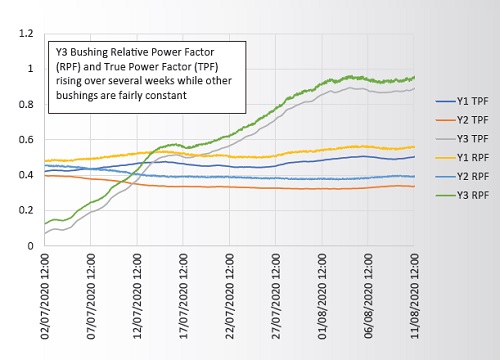
Figure 3. Relative Power Factor and True Power Factor for a set of three bushings
The bushing remained in service, and something unexpected happened: the power factor of the suspect bushing, from both relative and true values, started to fall, as shown in Figure 4, heading back to previous levels.
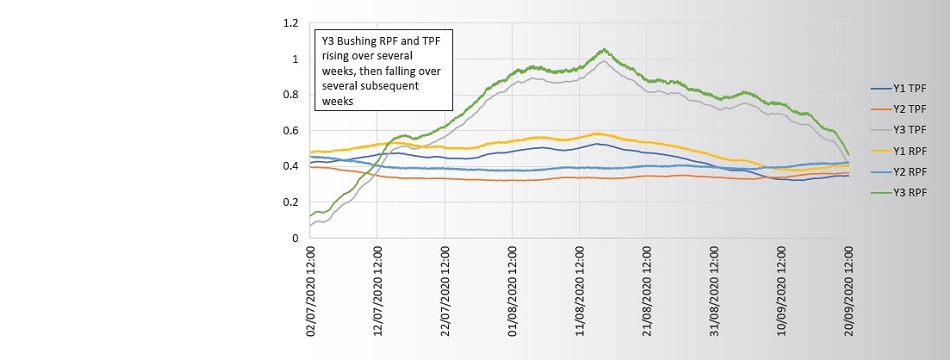
Figure 4. Bushing Power Factor – unexpected results
Although unlikely, we might ask whether the bushing has stopped the deterioration and put itself back together. Generally, once the insulation has deteriorated, it only deteriorates further over time – so we need to find a way to rationalize the results in terms of what could happen in practice.
The phenomenon of reduced or negative power factor has been known and discussed for decades [2]. An excellent detailed discussion presented by Long Pong [3] showed negative power factor results obtained through standard offline tests in a number of different applications. He gives a simple model of a test object, in this case a bushing, as shown in Figure 5.
The applied voltage, V, produces a current in the test object IC1, with the bushing capacitance being ZC1. If the C1 was purely capacitive, the phase angle θ would be 90°; in practice there is a small resistive component so θ is very slightly below 90° and is exaggerated in the figure.
The measured current is given by Equation 1.
Generally, once the insulation has deteriorated, it only deteriorates further over time. So we need to find a way to rationalize the results in terms of what could happen in practice.
 Equation 1. Basic equation for measured current in a bushing test
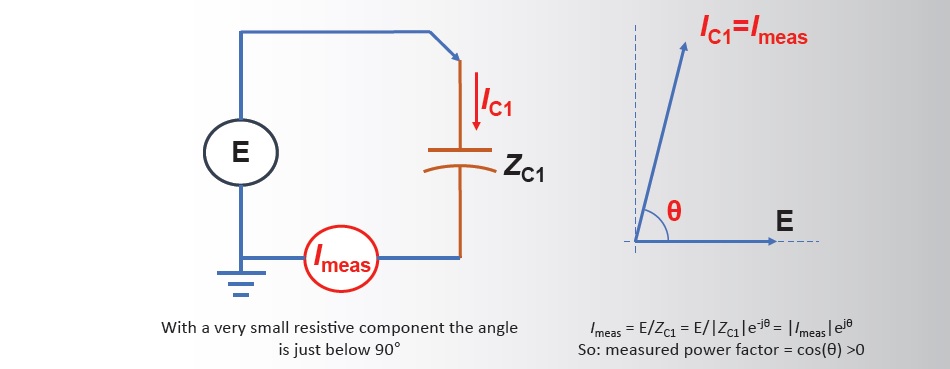
Figure 5. Simplified Bushing Measurement Circuit
This simple model can be extended by adding a resistive path to ground within the test object – such as may be introduced by moisture or contamination, as shown in Figure 6. The ZC1 value for the bushing is now split into two parts, Z1 and Z2.
The measured current in this case is given by Equation 2.

Equation 2. Measured current in bushing test with resistive path to ground in place
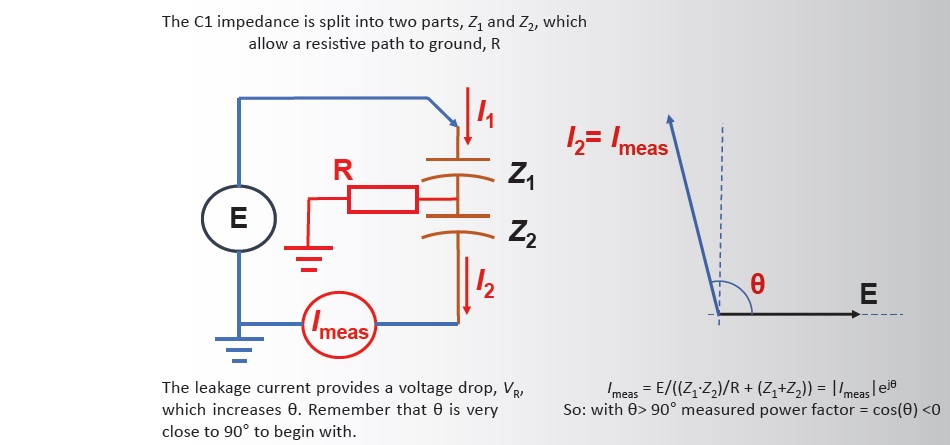
Figure 6. Bushing model with additional resistive path to ground
The additional resistive path adds the complex product Z1·Z2/R to the calculation of measured current. This product has the effect of adding an impedance accounting for the impact the current diverted through R has on the measured current. It shifts the measured current phase angle, θ, to be slightly above 90°, with the power factor now being negative.
How does this help in our case? We have had a rising power factor, then a falling power factor: one possible explanation for this set of events would be based on the oil fill cap for the bushing being damaged. Moisture and contamination would get into the bushing in small amounts, which would raise the power factor of the oil and thus the C1 bushing power factor – reflected in a rise in power factor value provided by the monitor. As more moisture/contamination enters, a resistive path to ground develops and grows, reflecting the situation in Figure 6, and the power factor of the bushing drops as that effect becomes dominant. Given time, the power factor would become negative.
It was noted during the subsequent bushing forensic tear down that the oil fill plug gasket was cracked and significantly deteriorated and the oil in the bushing contained visual sediment, particulates, and free water. It would seem that slow ingress of moisture was not only a possible cause for the effect seen, but had in fact occurred, and would explain the resulting unexpected variation in power factor measurements.
Discussion
Condition monitoring usually provides a simple link between measured data, analysis and subsequent alert generation. When monitoring data changes, it may be a simple case of linking the values to deterioration and on to a failure mode, allowing for planned intervention. But, occasionally, the data is unexpected – there is an anomalous response – and it should be investigated.
Such investigation should focus on finding an explanation for the data, and should include:
-
Verifying that the data makes sense – ensuring there is no sensor or data acquisition issue.
-
Consideration of what is actually measured and what is subsequently derived – and how the process can be disrupted.
-
What could be a possible physical explanation for the results seen? Does the explanation make sense?
-
What are we missing? Something small may have big consequences.
The second case discussed here is just one example of unexpected data and the subsequent attempts to identify a possible cause for what is seen, based on offline test analyses in prior technical papers, with the possible cause subsequently confirmed during the forensic teardown.
Generally, once the insulation has deteriorated, it only deteriorates further over time. So we need to Condition monitoring usually provides a simple link between measured data, analysis and subsequent alert generation. But, occasionally, the data is unexpected – there is an anomalous response – and it should be investigated.
Acknowledgments
Many thanks to industry colleagues for their discussion on this subject, with special thanks to Steve Skinner, Long Pong and Dr. Mark Lachman of Doble Engineering.
References
-
Wyper, G. MacKay, T. McGrail, “Condition Monitoring in the Real World,” 81st International Conference of Doble Clients, Boston, USA, 2013
-
Kopaczynski, S.J. Manifase, “Negative Power Factor of Doble Insulation Test Specimens (An Analysis),” 55th International Conference of Doble Clients, Boston, USA, 1987
-
Pong, “Review of Negative Power Factor Test Results and Case Study Analysis,” 70th International Conference of Doble Clients, Boston, USA, 2002