

ENERGY TRANSITION
This article discusses four grid technological innovations that are changing the way power substations work and giving grid operators the ability to better manage those substations and the network as a whole–paving the way to meet changing energy demands.
Key Challenges and Opportunities with Grid Modernization
The energy transition is at hand, but its success relies on our ability to adapt our aging power infrastructure to support the integration of more renewable energy resources. Innovation and the digital transformation of the grid substation are crucial to evolving our technology rapidly enough to meet the world’s rising demands of green energy. In this article, we discuss four grid technological innovations that are changing the way power substations work and giving grid operators the ability to better manage those substations and the network as a whole–paving the way to meet changing energy demands.
First, we examine the use of data in the move from time-based to condition-based maintenance and performance of primary substation equipment, such as power transformers. We also explore grid sensing with analytics to improve network utilization. We then consider the new flexible architectures of the digital substation, and how they create a more scalable, grid-reliable control and automation platform that is ideal for tomorrow’s power system evolutions. Next, we look at grid system integrity and protection schemes for high-speed grid stability controls. Finally, we discover how secured wireless technologies, such as licensed/unlicensed radios or private LTE (long-term evolution) networks, are bringing industrial-grade reliability and security with the integration of distributed energy resources (DERs).
Grid Infrastructure - Major Challenges and Opportunities
The electrical grid has been largely evolving for over 100+ years. So, why now? In speaking with many global utilities and heavy power users, three clear factors have emerged as being driving forces: the need and push for decarbonization, the decentralization caused by the growth of renewables and DERs, and digitization–our ability to connect more assets and visualize more data than ever before. Digital transformation enabled by grid modernization technology in the transmission and distribution system will play a central role in the energy transition.
Power grid infrastructure has been built and maintained over the past century to deliver reliable, safer, and affordable electricity across communities and industries. With the integration of large renewable energy farms on the transmission grid, and distributed energy resources on distribution networks, several challenges and opportunities have presented themselves during the modernizing of decades-old grid infrastructures.
Digital transformation with grid modernization technology for the transmission and distribution system will play the central role between renewable generation and prosumers of energy. The four key aspects shown in Figure 1 illustrate grid modernization through innovation and digital transformation, including:
-
Improving grid performance and utilization of the existing infrastructure with innovations in grid asset (e.g., transformers, feeders) monitoring;
-
Enhancing grid reliability and flexibility with digital substations and software-defined automation and controls;
-
Maintaining grid stability and resiliency on large integrations of inverter-based renewable energy resources using system integrity protection schemes; and
-
Enabling cyber security with end-to-end communication for geographically dispersed DERs.
Grid innovations and digital transformation of power substations are accelerating the energy transition for global utilities.
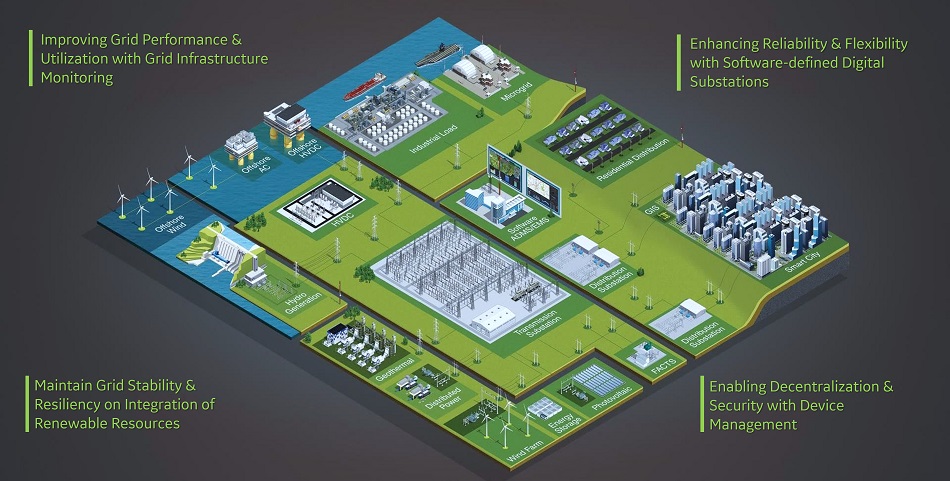
Figure 1. Grid challenges and opportunities
Evolving Grid Analytics Innovations
Power grid networks and equipment infrastructure are monitored and controlled by edge devices with sensors and actuators with some level of intelligent analytics. As illustrated in Figure 2, the evolution of grid edge analytics innovations moves from a reactive management strategy that responds to failures after they occur to a more autonomous future state with self-healing.
The majority of existing grid edge analytics are reactive to failures to limit damage, with limited responsiveness to restore automatically. The predictive stage may utilize system or asset models with a combination of physics and machine learning methods, including anomaly detection, classifications, and/or learned patterns. Further grid innovations can be applied to suggest potential implications and recommended actions. Finally, the autonomous grid with self-healing would use edge-to-edge communications with very limited or no human interventions.
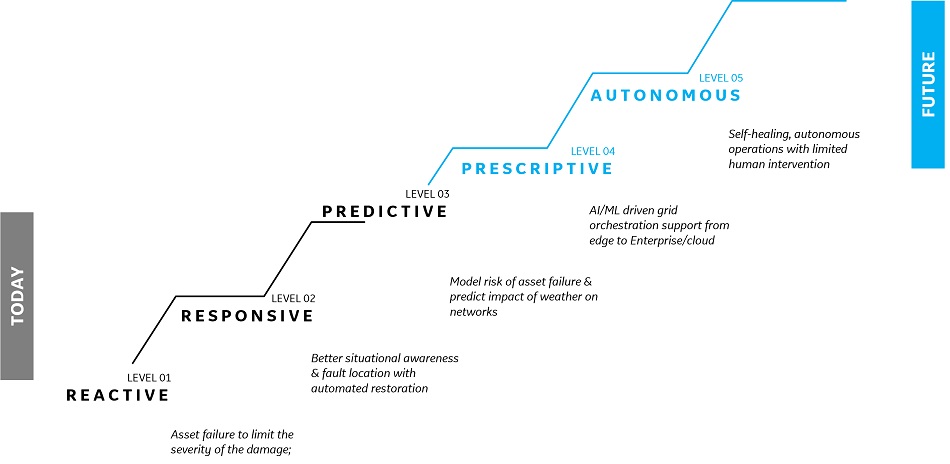
Figure 2. Evolution of grid analytics steps applying to monitoring and controls
Grid Innovations for Online Asset Condition Monitoring
The aging of the existing installed base and the lack of sufficient upgrades of the grid infrastructure are challenging for grid reliability, resiliency, and affordability.
There are several methods of condition monitoring, generally categorized as the following:
-
Automatic and online: Continuous monitoring applied while the asset is running; analysis performed without human intervention
-
Automatic and offline: Scheduled monitoring applied when the asset is stopped; analysis performed without human intervention.
-
Manual and online: Continuous monitoring applied while the asset is running; analysis performed manually on collected data.
-
Manual and offline: Scheduled monitoring applied when the asset is stopped; analysis performed manually on collected data.
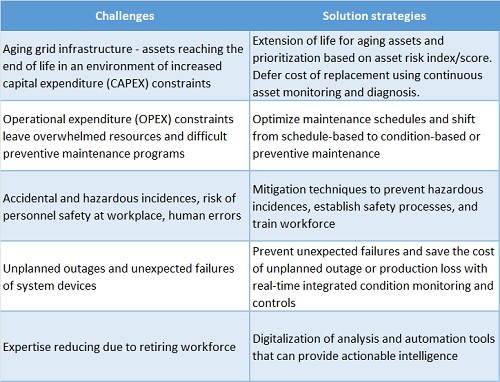
Table 1. Grid asset management challenges and solution strategies
Normally, the online methods require additional devices connected to the sensors applied to the equipment whereas the offline methods require scheduled shutdown to perform the tests. Autonomous monitoring and diagnostics need enough processing capabilities and memory within an edge device whereas manual monitoring and diagnostics require time from an expert team to perform analysis and prepare asset health reports.
Power Transformer Example
An example of power transformer equipment monitoring and diagnostics is presented below which can provide risk index and score with actionable condition-based maintenance through a combination of electrical, chemical, and thermal data. Power transformers are among the most critical power substation assets required to maintain a reliable and efficient power supply. Yet more than half the transformers in the developed world are several decades old or older. With almost half of transformer failures caused by insulation degradation and electrical abnormalities due to aging, extending the life of these devices has become a top priority for major power utilities.
Figure 3 presents integrated condition monitoring of the transformer using protection relay and dissolved gas analyzer data. Traditionally, a transformer protection relay is connected to current and voltage transformers to obtain the currents and voltages needed to detect electrical faults. It is interfaced with circuit breakers for control actions. In addition, dissolved gas analyzer devices connected to a transformer can draw oil samples regularly and perform continuous chemical analysis.
In the past, these two distinct systems (electrical protection and chemical monitoring) have not been interconnected. Since both systems provide much-needed asset and performance management data, bringing them together provides a more comprehensive view of the transformer’s overall health as shown in the figure. This integrated approach of combining two systems (a protection relay with electrical functions and a dissolved gas analyzer with chemical analysis) allows tracking of trending incipient fault events with the same timestamps, a correlation between the electrical and chemical models, and integrated asset health analysis and reporting.
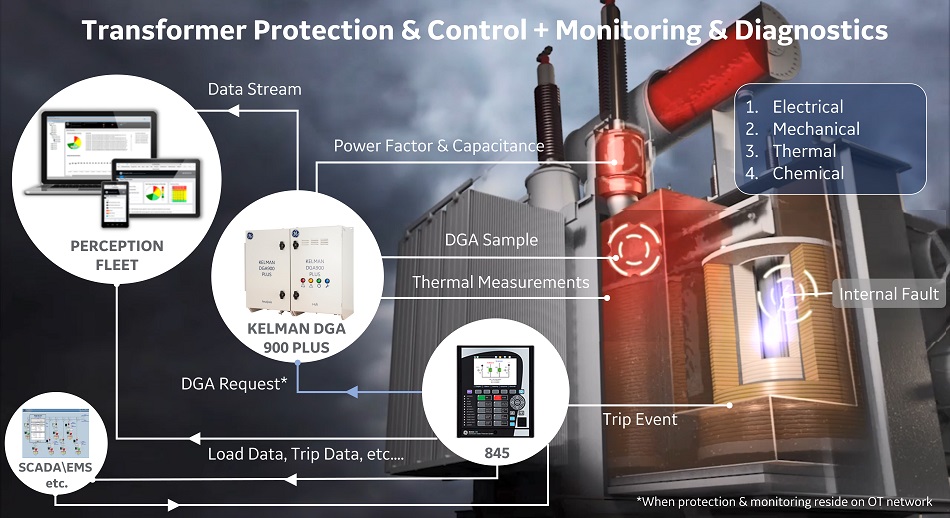
Figure 3. Holistic electrical, chemical and thermal models for transformer monitoring and diagnostics
With deep equipment design expertise, proactive functions are designed to continuously perform online equipment condition monitoring in combination with protection and control measurements of the equipment to be protected. Proactive functions take a holistic approach to the equipment to be protected, capturing the entire evolution of a potential failure, including:
-
detecting an anomaly or degradation of a subcomponent of the asset,
-
alarming the condition, and
-
recording and logging the signals and evolving changes.
Proactive functions are essential to detect critical asset degradation or anomaly conditions before they evolve into catastrophic failures. This avoidance of costs, damage, and reliability costs justifies the investment in this digital transformation.
The energy transition is at hand, but its success relies on our ability to adapt our aging power infrastructure to support the integration of more renewable energy resources.
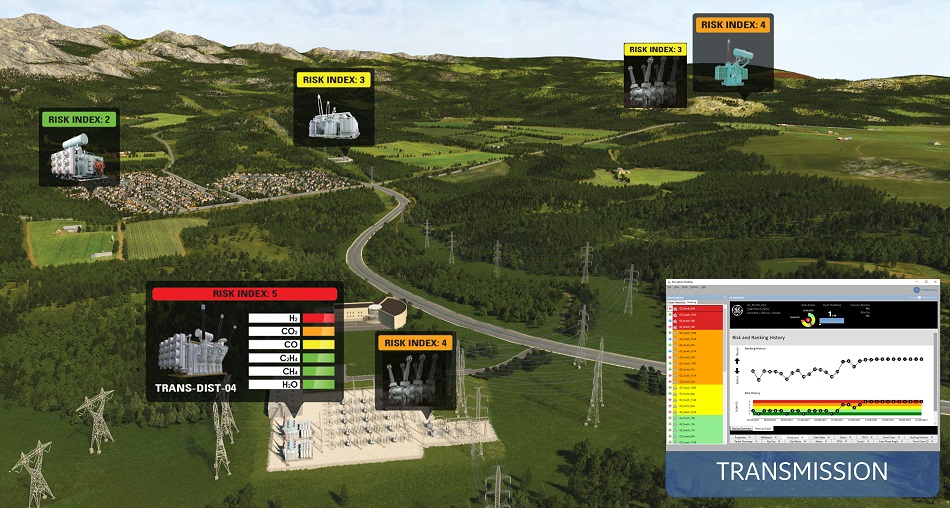
Figure 4. Fleet-view of grid asset risk indices
Data correlation models are time-aligned and trended among electrical, chemical, and thermal characteristics through a range of transformer conditions. Reports from the system (including the energization record, integrated transformer fault report, and transformer health report) allow capturing key operational dynamics that provide insight about both internal and through-fault conditions. Critical transformer data is compiled into reports and models that are easy to interpret, supporting informed decision-making. This ultimately delivers conditions for asset management optimization and potential for a transformer life extension, enabling operators to reduce capital and operational expenditures while maintaining the power system reliability demanded by today’s market.
With advancements in data analytics, interoperable data communication, and high-speed networking, the availability of data for advanced analytics is ushering in a new era of predictive analytics. New predictive analytics can be applied to build proactive functions which do not just limit but can prevent catastrophic events. Digital protection relays are checking for anomalies around every 2ms. Instead of witnessing the evolution of equipment failure until the set threshold of traditional protection function is reached, proactive functions can provide early warning upon detection of abnormal operating conditions. These can be key inputs to managing assets using digital data.
Figure 5 presents an example of a transformer model from its health report. When a protective relay detects an internal fault, it trips the transformer. External or through faults, however, can result in high current flow through the transformer before the device is tripped offline, causing significant stress on the transformer. A typical distribution utility experiences about 15 to 20 through faults each year even in advanced distribution systems. Research demonstrates that many transformers that fail catastrophically start showing indications of problems immediately following a through fault event. Developing situations such as these are more easily detected with visibility into pre- and post-fault electrical, chemical, and thermal data. In the transformer relay, this data is delivered via the user-friendly integrated transformer fault report. This graphical fault report can provide a clear visual indication of the fault condition as well as any changes to the transformer’s health.
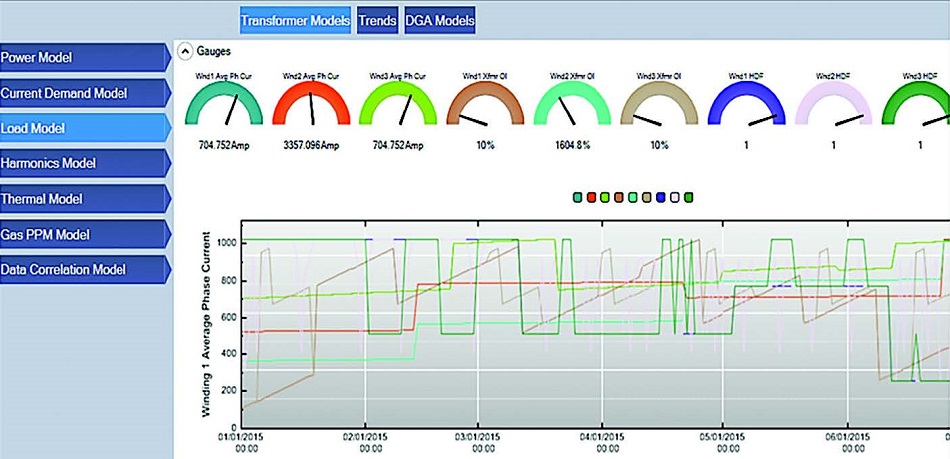
Figure 5. An example of holistic transformer health models
This integrated solution provides a heightened level of visibility, allowing the data to be applied in a meaningful way to maintenance or troubleshooting needs. An asset health report gives a snapshot of the transformer’s condition, and helps utilities analyze the following:
-
Risk assessment of the transformer population in service, especially critical transformers and important connections;
-
Condition assessment of individual transformers, identifying those which may require follow-up such as visual inspection, diagnostic measurements, and maintenance; and
-
Proactive risk mitigation actions for transformer asset management.
An Example of Grid Utilization and Fault Location
The integration of renewable generation into existing grids is increasing. One of the main challenges is that power flows are uneven and decentralized, and line loading at specific points in the network becomes uncertain with the change in the feed. This challenge is reduced with real-time or near-time grid visibility. Using dynamic line rating data monitored by sensors, the power handling capacity of the line at specific points can be determined. This allows the utility to provide improved power quality and a better-managed system with increased visibility into the network. With a regulatory requirement to minimize outage times, it is important to detect and locate faults and disturbances across the distribution grid using overhead line monitoring devices. The integration of monitoring data received from line monitoring devices with distribution management system helps improve the reliability and safety of the system, and thus optimizes the use of the network. Typically, line monitoring devices are mounted at strategic points in the overhead network. The system is shown in Figure 6.
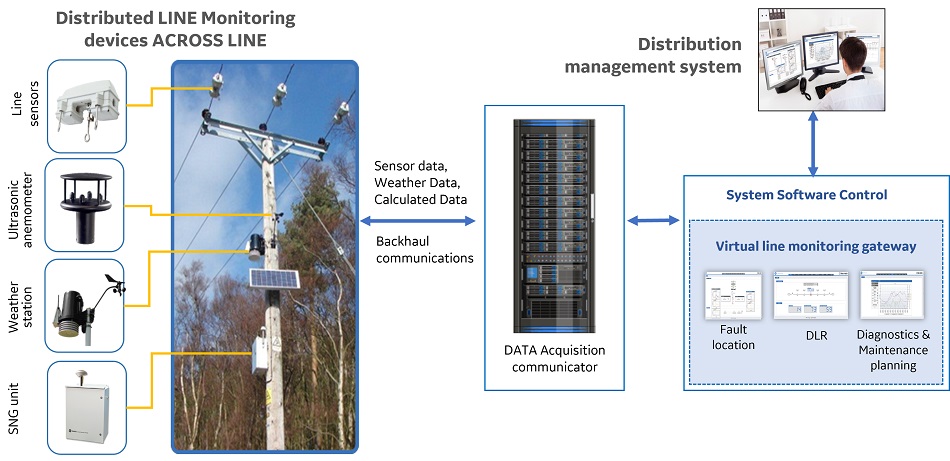
Figure 6. Line monitoring interface system
These line sensors measure current and calculate both amplitude and phase of the root-mean-square value, and have built-in communications. The sensors can pick up fault currents and report this current data back via radio to the sensor network gateway (SNG). The SNG links a network of sensors together, sending commands to the sensors and receiving data. This data consists of current values, fault event current data, or other related information, such as temperature, etc. The SNG links back to the data acquisition communicator unit. The unit is generally mounted in the substation, and its function is to record the activity of the sensor network. It acts as a database for line status including events like line loading, tripping faults, or sub-tripping events. The data acquisition communicator also links the sensor network to the system software controls.
The system software controls the entire network at one central location and can include a virtual line sensing gateway that provides access to faults and line loading data centrally. It also provides a platform for line monitoring analytical applications such as:
-
fault location and fault signature,
-
dynamic line rating,
-
local sag/clearance estimation, and
-
remote system diagnostics and maintenance applications including remote SNG and line sensor firmware updates.
This software can be stand-alone or be integrated into a distribution management system with mapping and maintenance functionality.
Line sensors can be installed at demarcation points where the utility network connects to local grids, allowing the utility to discover line faults and determine whether the issues are upstream or downstream. This saves them about 35% in the number of truck rolls. The combination of auto-recloser technology and down conductor detection line monitoring can help mitigate wildfires risks. Also, with the combination of distributed fault detection, isolation, and restoration, this combined technology can help the utility move towards the goal of a “self-healing” grid.
As substation devices continue to evolve, and we continue to capture and visualize more ‘real-time’ data about individual substation assets, the next level of value for grid edge peer-to-peer device analytics may be moving from predictive to autonomous operation. We are starting to see this evolution now as machine learning and artificial intelligence capabilities are being implemented into field and edge devices. For example, protection relays can trend operational data and use built-in artificial intelligence/machine learning algorithms supervised by logic and controls to take prescribed and approved actions–thereby minimizing the need for truck rolls or manual human intervention.
Evolving Digital Transformation Across Grid Infrastructures
This section presents the digital transformation applied within the substation as well as outside the fence of transmission and distribution networks.
Architecting Flexibility and Safety with Digital Substations
More and more utilities are investing in new protection, automation, control (PAC) systems in substations. They are doing this for several reasons. First, it allows for a smaller control house footprint which saves money in construction. It also allows for significantly less wiring between devices which lowers cost and reduces the opportunity for miswiring. It also allows for significant data to be available for utilities to use to monitor systems and leverage in their asset management programs. The SF6-free technology innovations such as green gas (g3) enabled switchgear already provide clean primary equipment for the grid.
Figure 7 shows the hierarchical architecture of a digital substation PAC system divided into three existing levels: process, bay, and station. Considering the technology cycles discussed earlier, the process level needs to “simplify” through digitization using open standard data sharing communication interfaces (i.e., IEC 61850-9-2LE and/or IEC61869-9/13). The bay level should be able to “converge” PAC applications with centralized substation protection systems. The modularized hardware of PAC intelligent electronic devices (IEDs) can provide completely independent communication ports to facilitate cyber security perimeter segregation for process bus and station bus. The station bus can be designed as “future-proof” with software-defined applications for the grid of the future. As the grid/substation evolves (such as through renewables penetration), the scalable substation control/automation application platform can allow future applications and solutions without replacing the hardware or platform software.
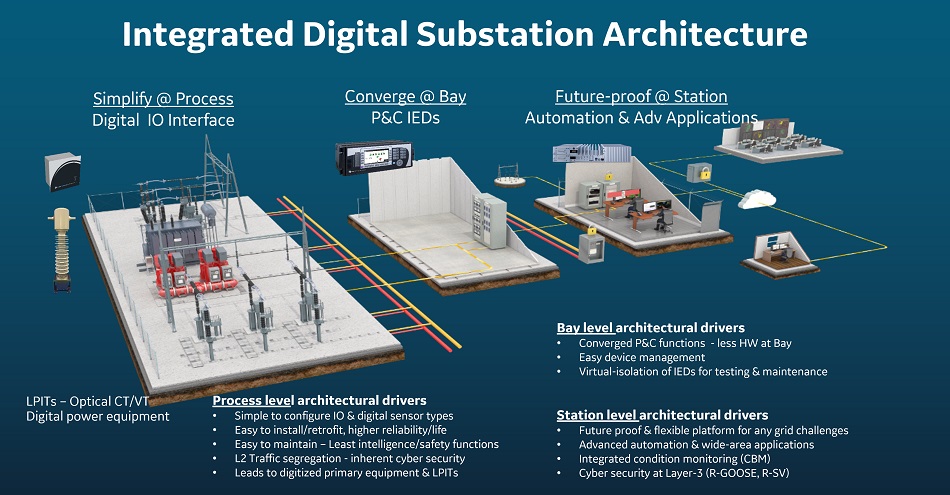
Figure 7. Digital substation architecture
Process interface units installed close to, or as part of, primary equipment, are used to digitize the signal interface and communicate to process bus over interoperable IEC 61850-9-2 or IEC 61869-9/13 standards. The software and settings at the process level need to be minimal or, if possible, with minimum settings and segregated layer-2 (ethernet) level traffic. Easy-to-install and maintain hardware delivers higher reliability and, with interoperable protocols, this data would be available to any application at the bay or station level.
Centralized Substation Protection System
Centralized protection and control (CPC) is a concept to combine the function of several IEDs into single hardware as illustrated in Figure 8. This allows more efficient use of processing power and achieves cost-savings by reducing the amount of hardware used. While achieving the cost-saving is important, CPC shall not compromise the stability and neglect the reliability offered by a conventional solution. Therefore, it is important to find a balance of saving without overlooking the criticality of power system operation.
CPC is not just about a single centralized protection device because this device alone will not bring benefit to the user. CPC is a system involving process-level digitization and a substation human-machine interface. Having all functions running in one centralized hardware opens some new requirements, such as the need for robust cyber security in a CPC unit, redundant systems to prevent maloperation due to a faulty device, and time synchronization. Please refer to the IEEE Power and Energy Society Power System Relaying and Control Committee’s Working Group K15 report online for more details on the CPC system.
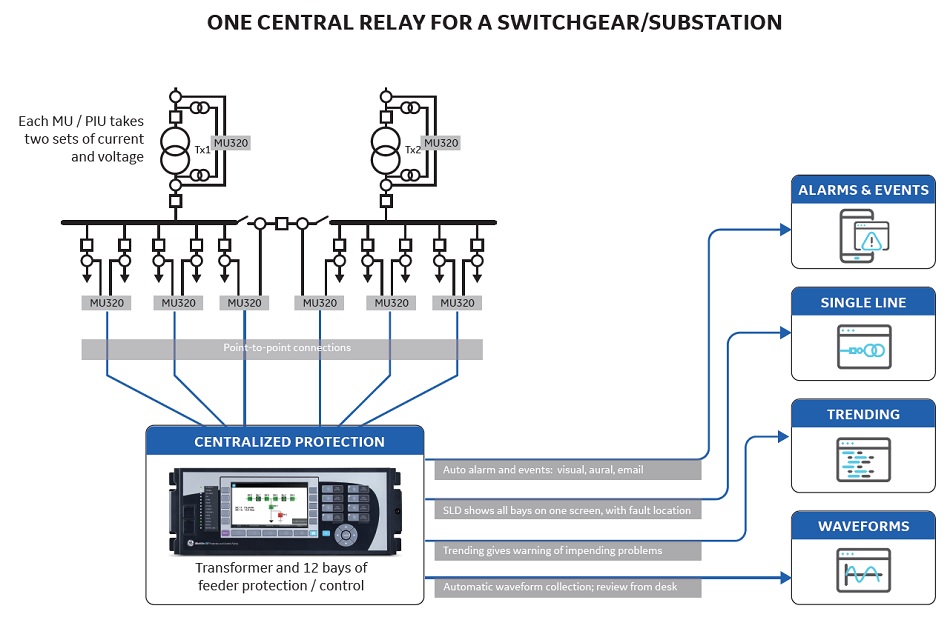
Figure 8. A centralized protection and control system
Software-Defined Automation and Controls
Figure 9 presents innovation driving software-defined grid automation and control platforms. The virtualized architecture may have the potential to migrate non-mission-critical substation automation from native specific hardware platforms to virtual machines or even cloud-native containerized applications.
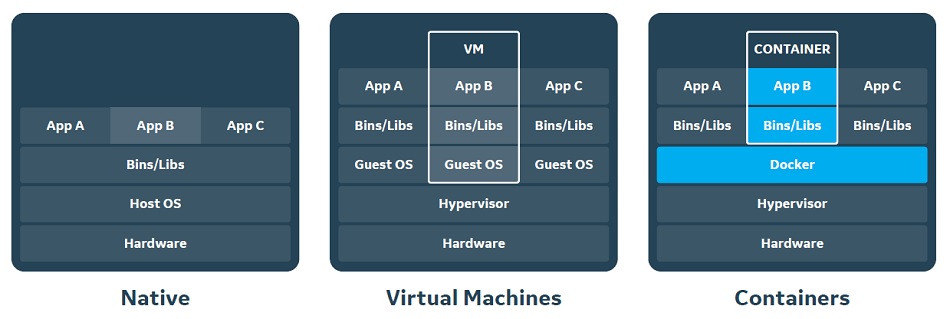
Figure 9. Software-defined grid controller architectures
Figure 10 provides the architecture of an advanced automation application system that allows a real-time operating system with a non-real-time Internet of Things operating system using virtual machine architecture. The hypervisor allows scalable multi-core CPU cores and execution of real-time grid logic along with a non-time-critical human-machine interface type of application.
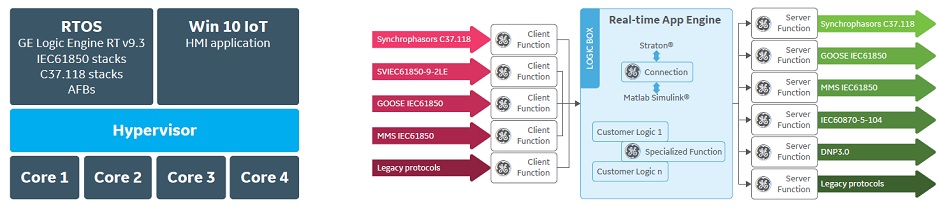
Figure 10. Software-defined advanced automation application system architecture
The advanced software-defined substation automation system shown in Figure 11 is using container-based architecture and a secure edge operating system lighter than typical virtual machines in terms of footprint and memory usage. They boot faster and use fewer resources than virtual machines. They can be deployed seamlessly across development, validation, and production and are easily portable across different computing environments. This system allows enhancement of grid reliability and flexibility to adapt to the changes that come with the integration of more renewable energy resources.
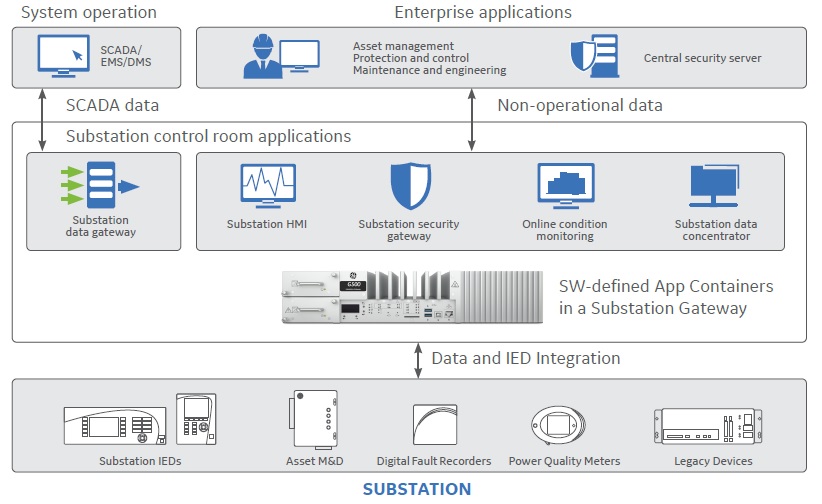
Figure 11. Software-defined grid control architectures
Secured System Integrity Protection System
System integrity (e.g., stability, and resilience) of the power grid provides fast controls across the transmission and distribution grid, especially with large integration of low-inertia renewable resources such as those shown in Figure 12. Such a system is also known as system integrity protection scheme, special protection schemes, or remedial action schemes. Of the entire system performance budget, three cycles (approximately 50 ms) are allocated for communication and controller/logic latency. Of the 50 ms, 38 ms is designated for communication latency and 4 ms for controller reaction time.
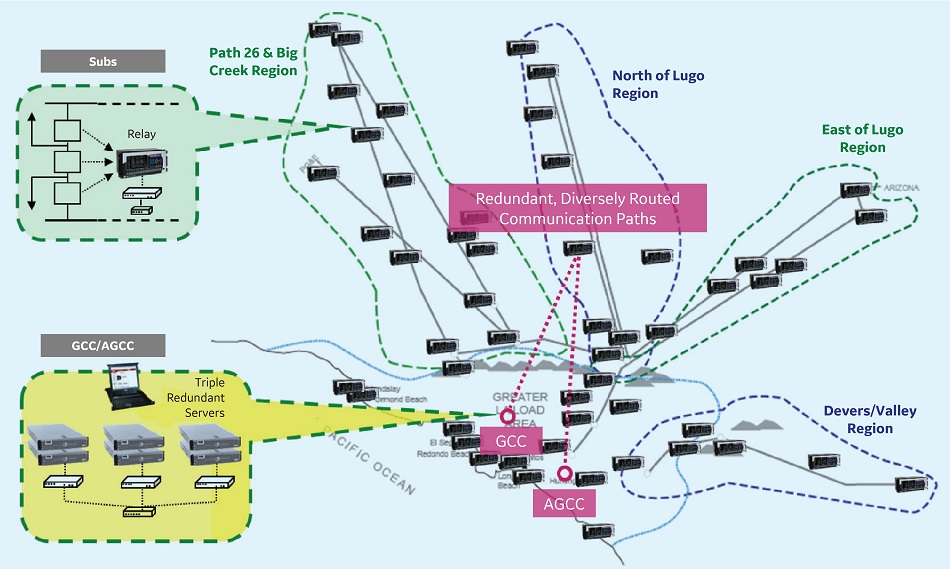
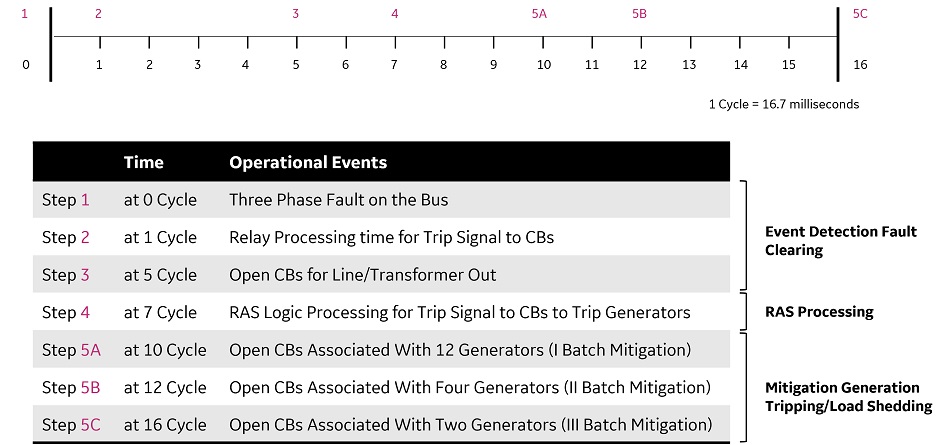
Figure 12. A typical example of a system integrity scheme with performance requirements
A generic object-oriented system event (GOOSE) mechanism is used for protection and control applications over local area networks. To use GOOSE over WAN for applications, the implementation of routable-GOOSE (R-GOOSE) protocol is used. High-speed (e.g., priority tagging), multicasting, and security mechanisms supported by R-GOOSE are used using IEC 61850 and IEC 62351 standards. Alternatively, the phasor measurement units and phasor data concentrator-enabled data-driven synchrophasor can be used based on applications, network bandwidth, and performance requirements.
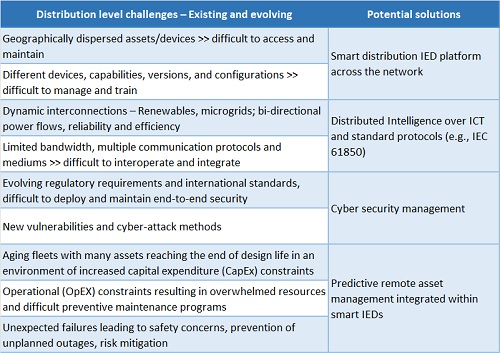
Table 2. Distribution level challenges and solution strategies
Secured Wireless and Remote Management for Decentralization
As mentioned earlier, a utility’s ability to collect and analyze both operational and non-operational data will be significant to unlocking business value while improving grid reliability, resiliency, and efficiency. As we deploy more sensors and devices “at the edge,” we need to think about the infrastructure required to securely collect and move data using grid secondary devices and primary equipment management systems. Traditionally, wired interfaces (copper or optical) were the most secure and efficient solution. However, advances in secure and cost-effective wireless technology have opened up many new utility applications on the distribution systems with the integration of DERs. With the ability to make these communications more secure, these technologies are delivering many new benefits.
Table 2 recognizes the existing and evolving challenges faced by distribution utilities and maps them to ongoing technology evolution to provide future-proof suggested solutions.
As illustrated in Figure 13, advanced industrial wireless technology offers inexpensive installation, rapid deployment, widespread access, and mobile/portable communications which wired technologies and older wireless technologies often cannot provide. As communication networks evolve and data demand from the network increases, advancements in industrial wireless technology are demonstrating strong applicability for various power grid applications. There have been recent advancements in industrial wireless communications that can be utilized by new protection, automation, and monitoring applications in distribution and industrial facilities to provide robust and reliable performance.
The ability to have smart meters send customer use and outage data, monitor and control a greater number of field-mounted reclosers, reconfigure circuits automatically, and deploy flexible demand programs can provide significant benefits to utilities now and in the future.
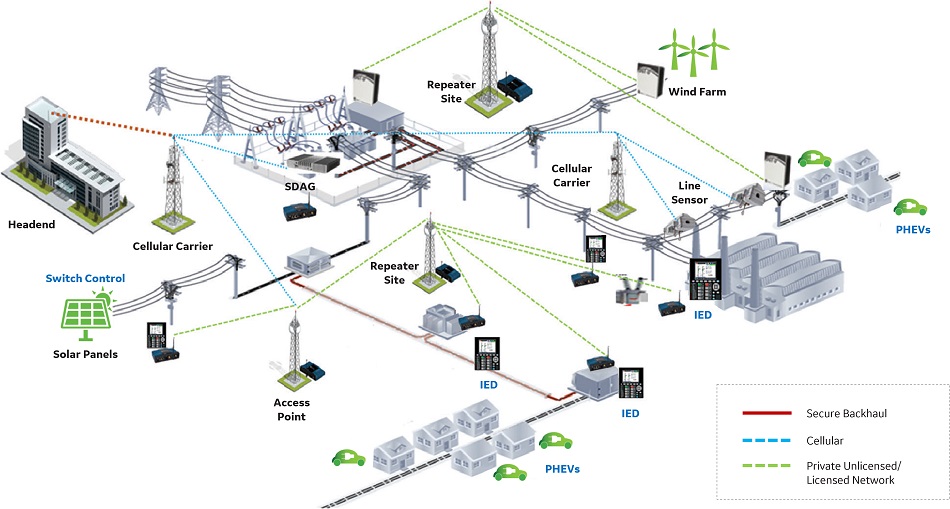
Figure 13. Example of a wireless communications network
Industrial strength wireless technology can provide the power utility with industrial-grade reliability, security, and performance. Today’s wireless devices are built with various substation-hardened standards, such as IEEE 1613 and IEC 61850-3, with the devices able to withstand electrostatic discharge and electromagnetic field radiation as well as mechanical vibrations and extreme temperatures commonly encountered in grid applications. Wireless networks are equipped with encryption technologies such as IP security (IPSec) and virtual private network (VPN) with key rotation used to enable an end-to-end encrypted IP tunnel through which data can flow securely between utility assets.
Like a private network, a public wireless network allows authorization, authentication, and accounting services. Suitable wireless technology should be selected based on criteria such as bandwidth, range, data latency, and regional frequency spectrum availability. Industrial wireless has already been applied for DER transfer trip, line/feeder fault location, distribution automation, PAC IED configuration, and remote DER or substation monitoring. The grid of the future will continue to rely on a strong communications infrastructure, and hybrid approaches that can extend or supplement existing wired systems with wireless solutions will be in the best position to meet current and future grid needs.
Conclusions
There is no question that grid innovations and modernization are helping to power the energy transition forward. Globally, the power grid industry needs more investment in grid modernization and the energy transition to allow more green electrons to flow while improving grid reliability, safety, sustainability, and affordability. The many parts and pieces of today’s grid infrastructures are insufficient to integrate more renewable resources and maintain supply through extreme external conditions, such as heatwaves or storms. The electric transmission and distribution system needs to be built with seamless bidirectional flow of electricity and secured data while considering hierarchical resilience upon network disruptions.
To address these challenges and unlock sustainable development, utilities are embracing grid innovations and digital transformation across transmission and distribution infrastructures. Grid innovation examples of analytics for automatic and online condition monitoring of grid networks and equipment are presented to improve grid reliability/availability and optimize operation and maintenance costs. The digitization of data is integrating previously siloed data streams to provide new visibility into the overall health of critical power system assets. Digital transformation of substations protection, automation and control systems with purpose-fit architecture allow convergence and flexibility using international standards for data communication.
Grid resilience and stability are presented with system integrity protection systems using high-speed secured peer-to-peer communications across the wide-area transmission network. At the distribution level for DER management and microgrid’s controls can be enabled with recent advancements in industrial wireless technology. It is applied to various power applications which may require lower deployment costs across geographic dispersed areas, mobility/portability, remote location coverage, rapid installation, etc. Cybersecurity requirements are achieved over both licensed/private and unlicensed/public wireless technology options.
The energy transition demands that we continue to modernize the grid to enable the integration of more renewable and distributed energy resources. Innovations such as those described in this article are helping while entering a new era of clean, reliable, and affordable energy all over the world.
Copyright notice:
© 2022 IEEE. Reprinted, with permission, from M. Kanabar, J. McDonald, P. Parikh, “Grid Innovations and Digital Transformation: Grid Innovations and Digital Transformation of Power Substations Are Accelerating the Energy Transition for Global Utilities,” IEEE Power and Energy Magazine, Volume 20, Issue 2.
Copyright for the pictures reserved by GE.

Dr. Mital Kanabar
Dr. Mital Kanabar is an Office of Innovation leader and global Applications Architect in Grid Automation (GA) of Grid Solutions business, GE Renewable Energy at GE Grid IQ Center in Ontario, Canada. Mital has 15+ years of power industry experience and holds 12+ international patent applications. He has published more than 50 journal/conference papers, 5 industrial magazine articles, and a book chapter. He holds an honorary Adjunct Professor position at OntarioTech University, Canada. Mital is also serving as a Chair and Vice-Chair of three Working Groups (WGs) at IEEE PES Power System Relaying Committee (PSRC). And, he is an active member of several technical working groups at IEEE, IEC, NERC and NASPI. Mital earned his PhD degree from the University of Western Ontario, London, Canada.

John D. McDonald
John D. McDonald, P.E., is Smart Grid Business Development Leader for GE’s Grid Solutions business. John has 47 years of experience in the electric utility T&D industry. John received his B.S.E.E. and M.S.E.E. (Power Engineering) degrees from Purdue University, and an M.B.A. (Finance) degree from the University of California-Berkeley. John is a Life Fellow of IEEE (member for 50 years), and has received a number of distinguished IEEE and IEEE PES medals and awards. John is Past President of the IEEE PES, the VP for Technical Activities for the US National Committee (USNC) of CIGRE, the Past Chair of the IEEE PES Substations Committee, the IEEE Division VII Past Director, and a member of the US National Academy of Engineering.