

ASSET SOLUTIONS: by Tony McGrail
Foreword from the Editor in Chief
One of the hardest jobs as Editor and Curator is editing articles from brilliant and gifted people. Tony and Ronald are two of those people. Both hold PhDs and both have extensive experience in their fields, but as you read this article you will notice that they attempt to make what is “complicated” by its very nature, much simpler, so we can grasp it. Dr. McGrail and Dr. Hernandez have taken the concept of singularity and applied it to statistical analysis for bushings data. Given that the only course I ever really struggled with at Georgia Tech (Yes, I am a Ramblin’ Wreck), was Statistics 301, I was grateful to see how well these two authors made their case.
Bushing Basics
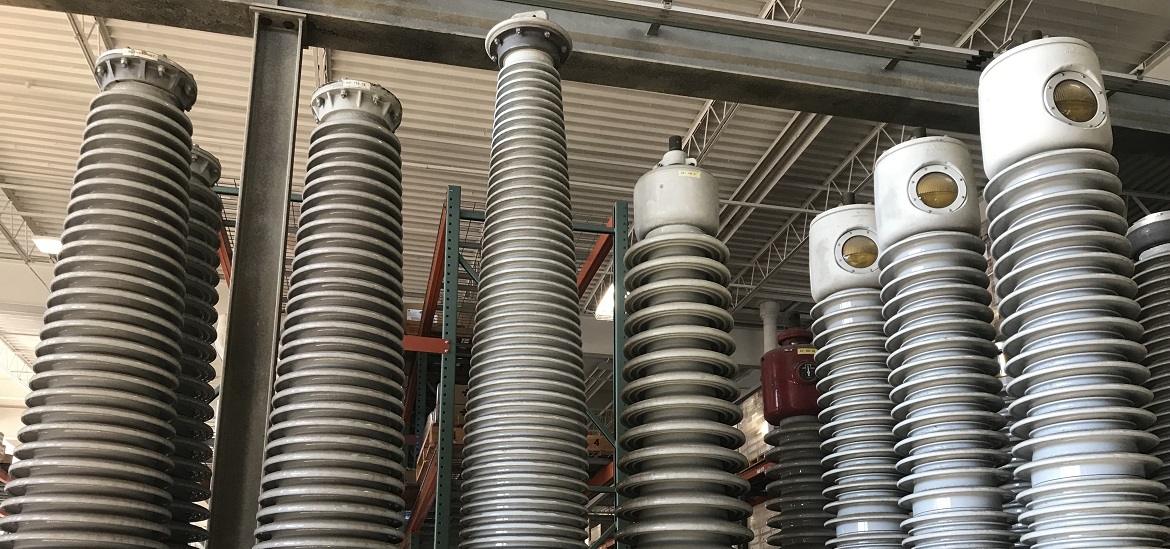
A bushing is a means to allow a conductor to pass through a barrier. Bushings can be quite complex as they need to distribute the electrical stress from the conductor evenly across their insulation [1]. Bushings are used with several asset types and are usually reliable devices, but, as with all assets, deterioration will occur and failure is a possibility.
An organization may have a large number of bushings to manage and will need data to support bushing decisions: the default position usually being “We have no new data, but it is still in service, so it must be OK.” This “Fix on Fail” approach can lead to problems as there is no warning of failure, and the bushing may well fail in a way which also destroys the power transformer it serves. The use of visual inspection, Infra-Red (IR) and Partial Discharge (PD) surveys can provide useful data and may help identify where deterioration is occurring, and where to focus attention, such as the overheating bushing in Figure 1.
Regular offline testing of bushings provides information about capacitance and power factor of the bushing insulation, checked against benchmark values (nameplate or first test measurement) to indicate if there has been any deterioration [2].
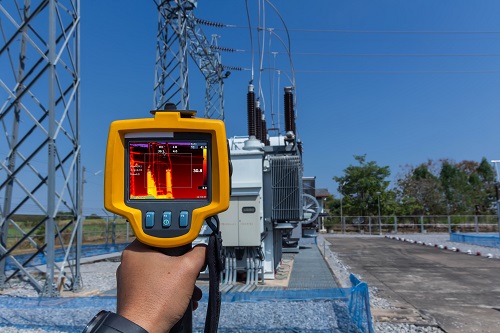
Figure 1. Overheating bushing
Note that bushings may have expected values for insulation power factor, but these will depend on the manufacturer and the individual design of the bushings. A common approach to evaluation is the following: If the test result exceeds 0.5% or double the nameplate value, then the bushing may be in a condition requiring replacement [3].
Case 1: Analysis of Test Results Referenced to Nameplate
One of the three GE Type U 345 kV high voltage bushings on a 375 MVA transmission class autotransformer manufactured in 1986 showed elevated power factor of 0.45% compared to the nameplate value of 0.27%. The other two bushings in the set were at 0.30% against the nameplate of 0.26% for each bushing. With no spare bushing available and the transformer needed in service for operational reasons, the transformer was returned to service with a bushing monitoring system in place to indicate any further deterioration. Ten months later, an outage was taken and the suspect bushing was replaced, using a Lapp Type POC. The other GE Type U bushings gave test results at nameplate values when tested, and the transformer was returned to service [4].
Less than four months later, the bushing monitor indicated an elevated power factor on one of the original GE bushings.
The rise in the daily trend reported for the two remaining GE Type U bushings is illustrated in Figure 2.
A rising trend had occurred after the return to service, and an offline test confirmed that the bushing had elevated power factor of 1.36%.
The capacitance had increased by just 2 pF against the nameplate value of 398 pF. The bushing was, thus, replaced.
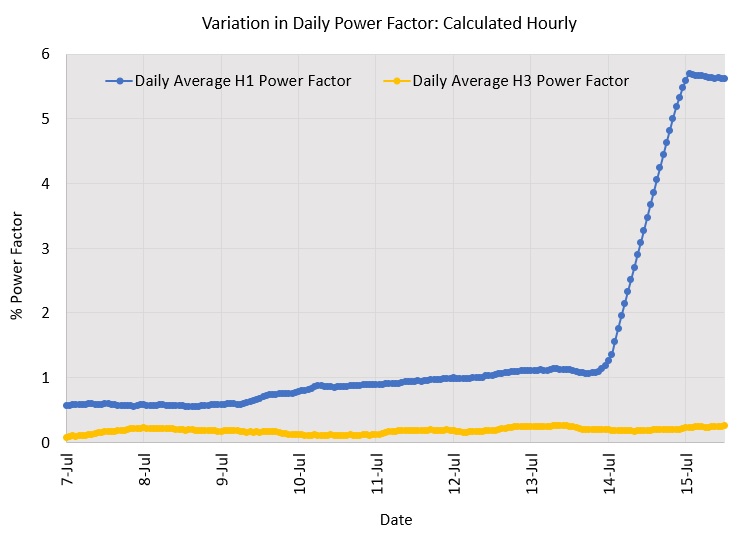
Figure 2. Case 1 - Monitoring detects rising power factor trend
The approach described in the original paper that outlined this case [4] is useful, and it involves identifying a bushing of interest through standard testing, but then applying monitoring to track the deterioration directly. A response plan is necessary to make sure that intervention is undertaken when alarms are issued. However, for the two bushings which were replaced it is interesting to note the following:
-
the original suspect Type U bushing remained in service for more than 10 months while being monitored and issued no alarms;
-
the subsequent Type U deterioration of the second bushing took place over less than 4 months to issue the alert.
The deterioration rate of an individual bushing may be different to others of the same type – and the future rate of deterioration may not be predictable, as it may depend on variation in load, ambient conditions, repeated energizations and other factors.
Case 2: Checking Against a Population – Is It an Outlier?
A deeper statistical analysis can be performed by comparing an individual bushing results to those of its ‘peer group’ or family: bushings of the same manufacturer, design and voltage rating.
A useful analysis for a population of bushings is to look at the difference (or delta) between the measured value of power factor (or capacitance) for each bushing and its own benchmark value; then use those results for the population to calculate the population mean, m, and standard deviation, σ, of the deltas by modeling the observed data. Anything lying more than three standard deviations away from the mean is considered to be an outlier [3] and worth investigating.
Note that the approach is not a diagnostic as we are looking for variations in ‘symptoms’ (the measured values) to allow subsequent investigation and diagnostics to identify the failure mode(s) in operation [2]. The data is also modeled against probability distributions to identify the one which gives the lowest deviations from the observed data.

Managing a population of bushings presents challenges – but also opportunities. The challenges are to identify those bushings which are most worthy of more detailed attention or intervention. The opportunity is to use the latest in statistical analyses of populations to augment traditional limit-based approaches to determine bushings of interest.
A utility electrical testing group obtained power factor test results for three ABB, 69 kV, type AB bushings, which seemed ‘a little high’ at ~0.5%. The utility compared the three results against their own database of 390 test results from 105 individual bushings. The delta values were calculated with respect to the first power factor measurement of each of the bushings. Figure 3 shows the distribution of delta values found, in red, and the gamma function resulting with the best fit, in blue. Bushings H1 and H2 are more than three standard deviations from the expected value (i.e. the mean), with only 2.22% of the population expected to lie in this region. They do appear to be outliers in the utility’s database.
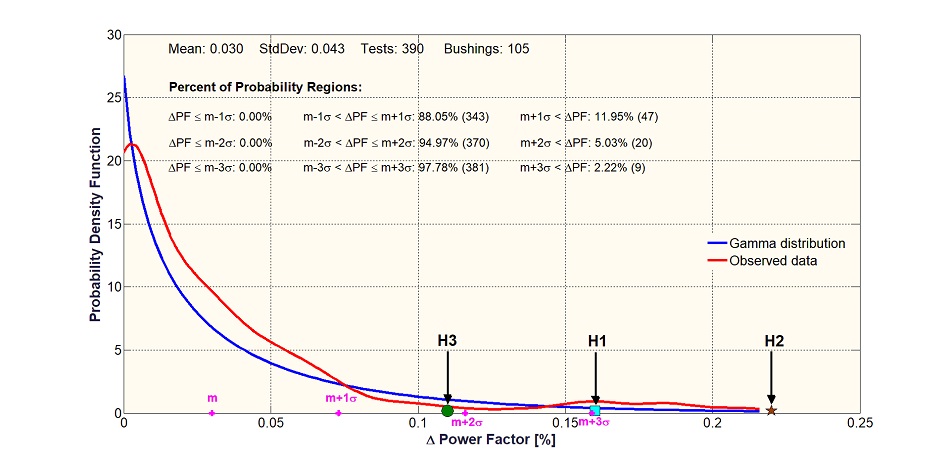 Figure 3. Case 2 ─ Bushing statistical analysis using utility’s database population
The same analysis was performed using the Doble database population of the same manufacturer, bushing type and voltage rating – with a total of 5,278 test results available for 2,723 individual bushings, as shown in Figure 4. Against this population, the anomalous results do not lie beyond three standard deviations – so they are no longer ‘outliers’.
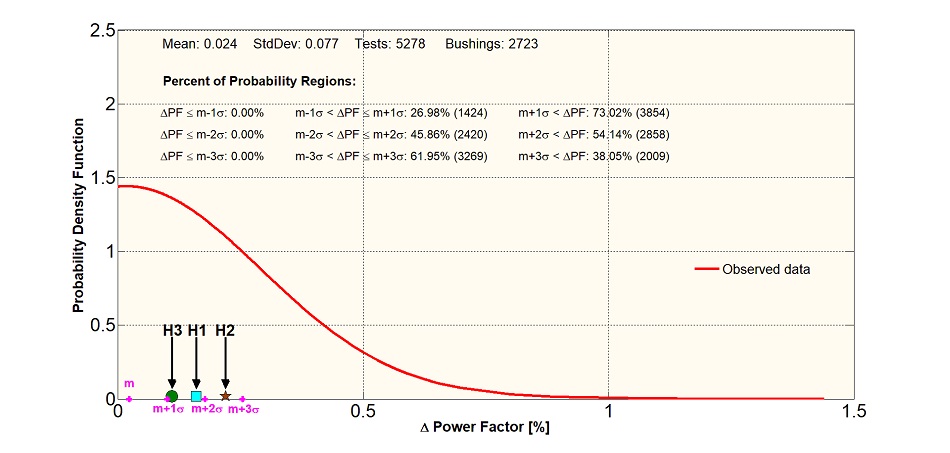 Figure 4. Case 2 ─ Bushing statistical analysis using Doble’s database population
As a result of the analysis, it was decided to leave the bushings in service: condition monitoring and increased frequency of testing are being considered.
Case 3: Not an Outlier – But Still Suspect?
It has been reported that the failure rate of Trench COTA 230 kV bushings, manufactured at three different bushing factories (in France, Switzerland and Canada) between 1994 and 2000, is higher than expected for bushings of this type [5]. A utility had 52 bushings of this type, with 108 individual test results, and wished to know if they had any instances of ‘outliers’ which could help focus their replacement program. Two bushings had seemingly acceptable power factor values, being <0.5%, but were outliers for the utility: maybe they should focus their attentions on those two?
Figure 5 shows the actual C1 delta between nameplate and test results distribution, in red, and the exponential model (best fit), in blue. The two bushings of interest are outside of three standard deviations from expectation – so acceptable results in terms of absolute C1 power factor values, but outliers in the utility population.
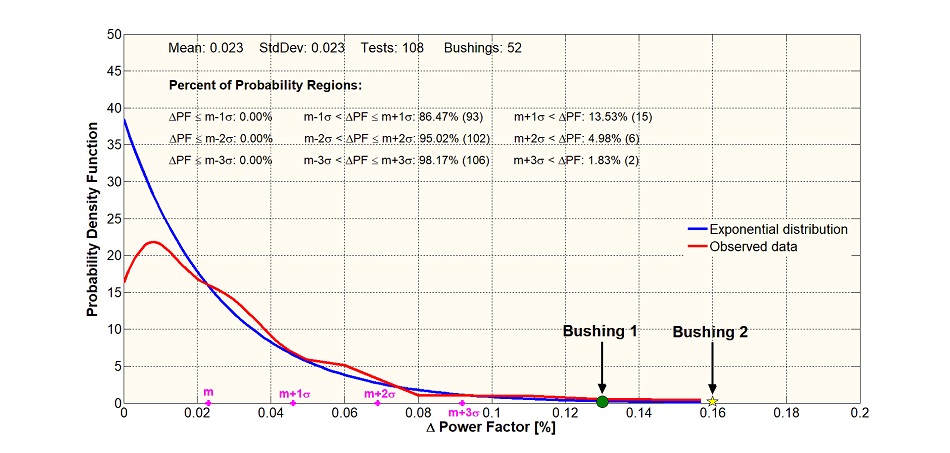 Figure 5. Case 3 ─ Bushing statistical analysis using only utility’s database population
Figure 6 shows the same analysis but using the entire Doble database population (442 bushings and 680 data points). The two bushings have C1 delta power factor values which are just outside of one standard deviation from expectation.
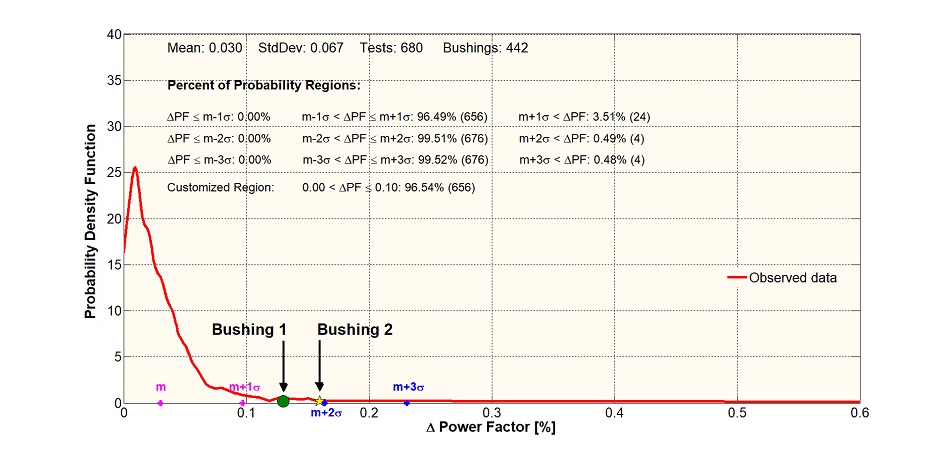 Figure 6. Case 3 ─ Bushing statistical analysis using entire Doble’s database population
Consequently, the two bushings are outliers in terms of the utility population but are not with reference to the larger Doble database population. But the fact that the larger distribution is very compressed, with ~96.5% of test results being below one standard deviation from the mean, indicates that the two bushings are anomalous – they are unusual, and the history for this type of bushing would imply that they should be prioritized for replacement, and/or condition monitoring should be considered to track their condition online.
Intervention requires evidence, and the statistical analysis provides that.

Discussion
Managing a population of bushings presents challenges – but also opportunities. The challenges are to identify those bushings which are most worthy of more detailed attention or intervention. The opportunity is to use the latest in statistical analyses of populations to augment traditional limit-based approaches to determine bushings of interest. The statistical analysis uses a large population of results, which relies on Doble’s daily updated database of more than six million individual test results. It provides a usable distribution of expected variation between test results and a benchmark value (nameplate or first test measurement); the approach benefits from a use of mean and standard deviation limits, but also allows for determination of just how many results lie below our individual result – indicating just how ‘different’ our result is. Intervention requires evidence, and the statistical analysis provides that.
Acknowledgment
The authors would like to thank our colleagues at Doble and across the industry for their discussion of bushings and related matters.
References
1. Doble Field Testing Webinar Series, Session 3: Dielectric Testing of Bushings
2. T. McGrail, “Power Factor: Offline, Relative and True,” Transformer Technology, Issue 6, June 2020, available at https://www.transformer-technology.com/community-hub/technical-articles/1306-power-factor-offline-relative-and-true-tony-mcgrail-byline-transformer-technology.html
3. R. Hernandez, M. Lachman, Enrico J. Quintana, Enhancing high-voltage bushing diagnostics through power factor/capacitance statistical analysis, 86th International Conference of Doble Clients, 2019
4. R. Wancour et al, Chronicling the Degradation of a 345 kV General Electric Type U Bushing, 76th International Conference of Doble Clients, 2009
5. A. del Rio, P. Hopkinson, Investigation on failures of Trench draw lead COTA bushings, 78th International Conference of Doble Clients, Sec. BIIT-1, 2011

Tony McGrail
Tony McGrail is Doble Engineering Company’s Solutions Director for Asset Management & Monitoring Technology, providing condition, criticality and risk analysis for utility companies. Previously Tony has spent over 10 years with National Grid in the UK and the US; he has been both a substation equipment specialist and subsequently substation asset manager, identifying risks and opportunities for investment in an aged infrastructure. Tony is a Fellow of the IET, a member of the IEEE, CIGRE, ASTM, ISO and the IAM, and is currently active on the Doble Client Committee on Asset and Maintenance Management and a contributor to SFRA, Condition Monitoring and Asset Management standards. His initial degree was in Physics, supplemented by an MS and a PhD in EE followed by an MBA.