

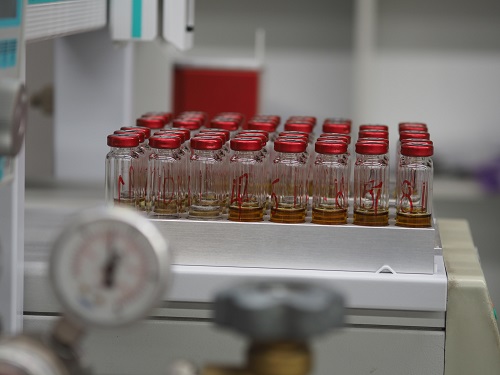
Image reproduction authorized by Hitachi Energy
THE STANDARDS
This paper describes the process followed by the revision working group to obtain the new set of norms for acceptable gas concentration levels, published in the “new” guide in 2019 based on a vastly larger DGA data set than the first edition of IEEE C57.104TM, published in 1978.
Introduction
The analysis of gases dissolved in transformer insulating liquid (DGA) was introduced in the 1960s to detect early signs of incipient faults. One of the earliest set of norms for acceptable gas concentration levels was developed by the former CEGB in the 1970s based on DGA results from one geographic region [1]. These values were used in the first edition of IEEE C57.104TM published in 1978 [2] and had remained virtually unchanged for four decades.
In 2000, a complete review of the IEEE guide was initiated. A slightly updated version was released in 2008 [3] and the "new" guide, with new norm values, was published in 2019 [5] based on a vastly larger DGA data set than the first edition.
This paper describes the process followed by the revision working group to obtain the new set of norms.
Data Sourcing
The revision began with accumulating a large dataset of recent DGA results from sources using current oil sampling and analysis methods. Contributors provided the data voluntarily, in good faith that it would be utilized for the sole purpose of revising the Guide. The raw dataset (“raw” meaning prior to any data processing) contained over 1,500,000 DGA reports from 18 contributors. Each report presented values of 9 dissolved gas concentrations: hydrogen, methane, ethane, ethylene, acetylene, carbon monoxide, carbon dioxide, oxygen, and nitrogen. Reports also contained information on equipment type, transformer type, number of phases, rating (MVA), voltage (kV), age, manufacturer, serial/ID number, oil preservation system, oil volume/weight, sampling date, analysis date, and the reason for the analysis (routine or investigation).
Data Cleansing
Initial Data Preparation
Once collected, the data “clean up” process began with the goal of discarding any data points deemed inapplicable, unreliable, or invalid, resulting in a processed, or “clean”, high quality dataset.
Some data points were discarded for lack of essential information. Additional data was discarded if the DGA results did not belong to transformers, or were from transformers out of service, or from in-factory testing.
One of the earliest set of norms for acceptable gas concentration levels was developed in the 1970s. These values were used in the first edition of IEEE C57.104TM published in 1978 and had remained virtually unchanged for four decades.
Second Level Filtering
Additional filtering was applied to eliminate duplicate results. Next, judicious corrections were made to some data point values with incorrect units for rating (kVA versus MVA) and voltage class (volts versus kV). Erroneous values could be corrected for some of the data by examining other accompanying variables such as oil volume and transformer type. While these corrections were cumbersome, this was necessary to not discard or misuse a disproportionate number of large or small transformers.
Data Anonymity and Security
The cleansed dataset was made anonymous by removing contributor names and replacing transformer serial/ID numbers with generic ID numbers. Furthermore, to address concerns from some of the data suppliers regarding its potential use outside of the guide revision, and in the absence of a formal Transformers Committee data repository, it was decided to permanently discard the data set after final processing and to limit the number of persons accessing and processing it to the three Officers of the Working Group.
It was also agreed that no single individual had the full data set in their possession at any time. Each Officer was responsible for only a subset of the data. The complete data set was assembled only once onto a single memory stick for the final analysis, handled in the presence of the 3 Officers and Working Group member witnesses.
After the analysis was completed and results were preserved independently of the raw data, the memory stick was reformatted and destroyed. While not optimal, this was a practical solution to address the data security concerns of the contributors.
General Characteristics of the Data Set
The data set population characteristics are as follow:
-
Number of data contributors: 18
-
Total number of usable DGA reports: 1,391,436
-
Total number of transformers: 313,076
-
Total number of DGA reports with transformer age: 618,715
-
Total number of DGA reports with transformer rating: 738,188
Figures 1 to 4 are graphical presentations of some characteristics of the data set: analysis year, transformer age, transformer rating, and number of days between successive DGA samples.
The raw dataset for the revision of the Guide contained over 1,500,000 DGA reports from 18 contributors.
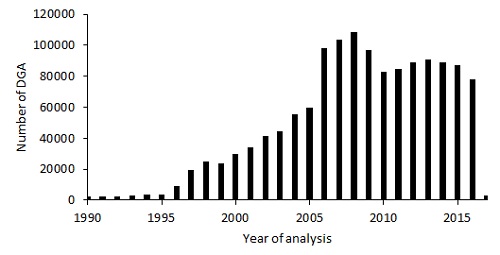
Figure 1. DGA report distribution as a function of the year of the analysis
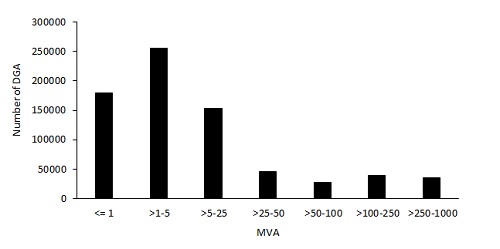
Figure 3. DGA report distribution as a function of transformer rating
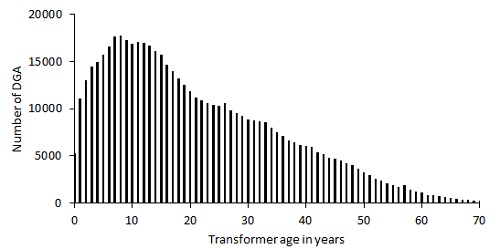
Figure 2. DGA report distribution as a function of transformer age at the time of sampling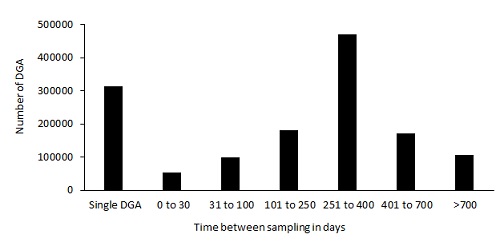
Figure 4. DGA report distribution as a function of time between samples
Table 1 provides the DGA report distribution as a function of the two principal factors used to segregate DGA: O2/N2 ratio and transformer age.
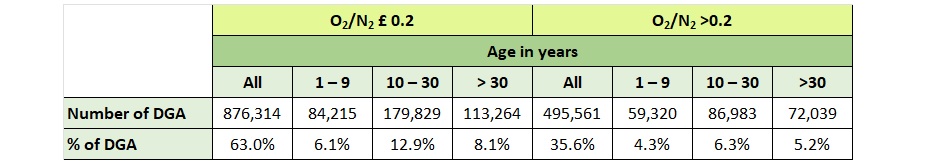
Table 1. DGA report distribution as a function of O2/N2 ratio and transformer age
Extracting Usable Information
The primary interest of analyzing the dataset was to obtain the limits used to detect an abnormal condition. The distribution of gas levels was not Gaussian, but rather follow a highly skewed inverse distribution, therefore classic sigma analysis was not applicable. On the other hand, the data distribution for a calculated gas concentration differential between successive analyses (called "Delta" in the guide) and for trend (rate of change) was almost Gaussian with an average of zero. To address this difference of data distribution types, we used percentile values for the norms, as the percentile value will always, by definition, represent the 90th%-point (or 95th%-point) of the population, irrespective of the type of distribution. There is precedent in several industries to use the 90th and 95th percentiles values as limits for anomaly detection in data sets, and these were likewise chosen for DGA.
Data Analysis
Preliminary Analysis
The three authors, independently of each other, performed several preliminary data evaluations of their data subsets of data, using both spreadsheets and R scripts, to determine how the complete data set should be analyzed and what parameters should be investigated. The analysis needed to be unbiased and applied consistently to all DGA reports from the clean data set.
In transformers, gas levels and generation rates are influenced by several factors. Therefore, it was initially attempted to establish various norms as a function of many such factors to discern between normal and abnormal DGA.
To decide which factors to use in the final analysis, a table was created of the gas concentration 90th and 95th percentile values as a function of a split in 2 categories (low VS high) for each factor considered. The percent difference was computed between the two values for each gas and the results were ranked as a function of the average differential. The factors evaluated were the O2/N2 ratio (less or more than 0.2), age (an exception with three split points: 1-10, 10-30 and >30 years), year of manufacturing (before or after 1987), rating (less or more than 10 MVA), voltage class (less or more than 60 kV), oil volume (less or more than 2000 gallons) and total amount of dissolved gases (less or more than 100,000 ppm).
It was deemed that more than two factors would render the 90th and 95th percentile limit tables too complex for practical use. Therefore, the two most influential factors were selected for the limit tables: O2/N2 ratio and transformer age. Manufacturing year was strongly correlated to age, so it was not used as a separate factor. Segregating the data further by MVA, kV, oil volume, and total gas content did not significantly influence the limit values and those factors were not used (see Table 2).
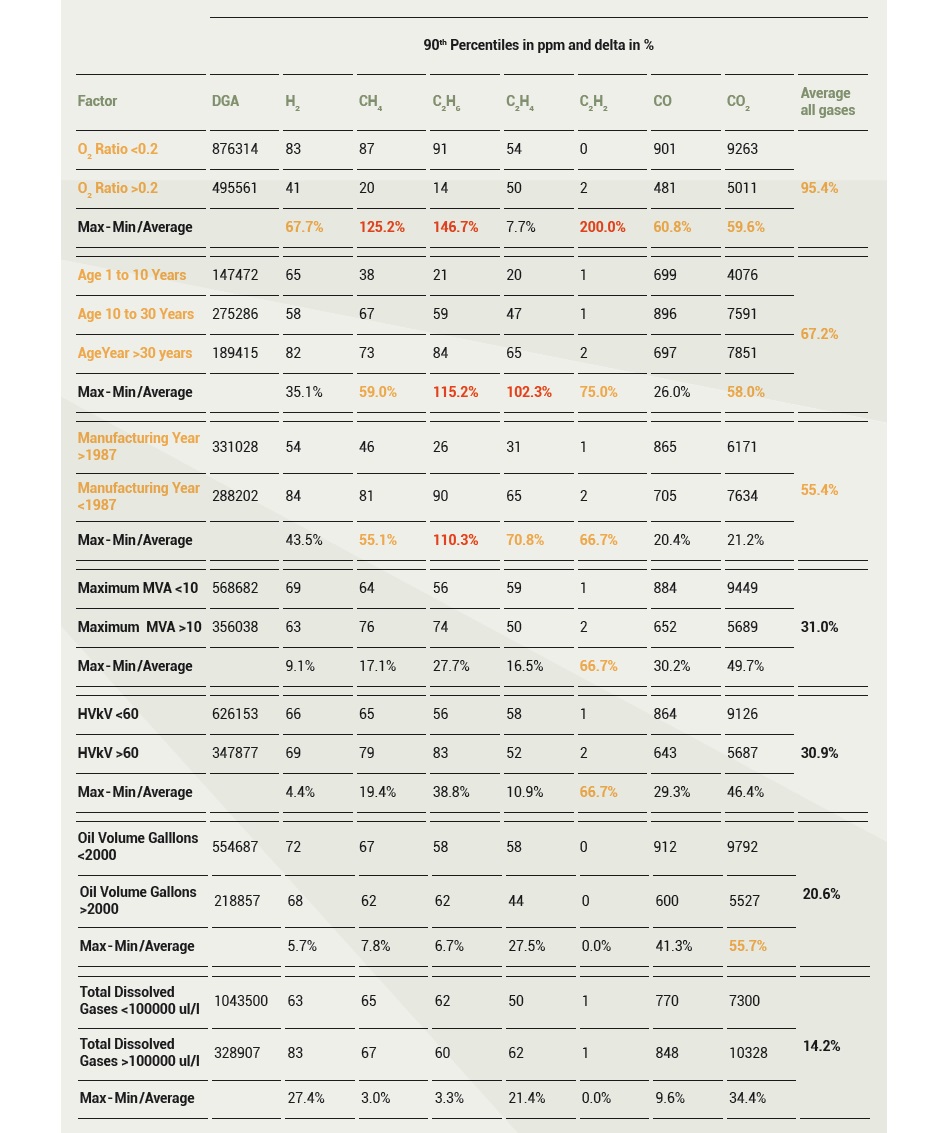
Table 2. Influence of various factors on limit values
Final Analysis
Final data analysis was performed with R software [4] scripts developed specifically for this task by the first author. In total, those scripts contained approximately 3000 lines of code and comments in native R (V3.3.2). To facilitate witness oversight of the final analysis, the "Read" and "Save" functions of the code, were specifically designed to read and write data to specific file locations in such a manner that the witnesses could verify that the original data was not copied to anywhere else other than onto a single memory stick. The final data analysis session, including several iterations and adjustments, was completed in two days.
Prior to data merging, each cleaned data subset (18 in total) was analyzed to verify the integrity of the data and to compute general statistics of interest to gauge variance among the 18 different data contributions. Given the large amount of data, one could be tempted into a false sense of analytical precision by theoretically obtaining extremely "precise" results (calculating 90th percentile limits to the nearest ppm, for example) and falsely assume that the result is perfectly representative of the industry condition. This is far from the real-life situation, where it is well known that typical (i.e.: 90th percentile) gas concentrations can vary widely from one transformer network to another. So, for each of the 18 data subsets, percentile limits were computed for each gas. Comparing the calculated limits between the 18 subsets confirmed their large variability, as illustrated in Figure 5 example. This also led to the necessity of limiting the number of significant digits used in the various tables of the guide, to not present a false sense of precision.
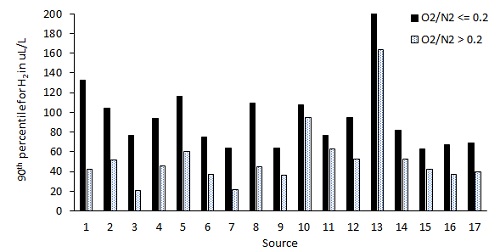
Figure 5. Example of the variations of percentile values observed between the sources (90th percentile for H2)
With the merged data, the next step was to process it to extract the desired information. This included generating percentiles for all possible combinations of factors, including those unlikely to result in usable data. This was done for two reasons: a) For each factor, the optimal breaking point was not known in advance so it was necessary to perform analyses with several different partition sets, and b) As the data would be destroyed after the final analysis, this was the only opportunity to collect as much analytical information as possible, and decide later what output would be used, discarded, or kept for future work.
Furthermore, some of the factor split points depended on the values obtained by the analysis itself. To be able to adjust those criteria during the process, the various factor break points were separated from the analysis script and stored in the form of loadable tables. As the analysis was progressing, it was possible to adjust those points based on intermediate results, update the files and repeat the process in an iterative way without having to change the script proper (which risks introducing new undetected errors). As an example of such iteration, delta and rate computation (Tables 3 and 4 of the new guide) were to be computed only from data below the selected 90th percentiles for level values, which was not known until the first part of the analysis was completed.
For each transformer, the gas level increase or decrease (delta) was computed from each pair of successive DGA (approximately 1 million pairs). Using the same data for each transformer, a series of successive overlapping sequences of 3 to 6 points were created and evaluated by a linear best fit (slope), providing approximately one million sequences. The 95th percentile values of these deltas and slopes were used to create tables 3 and 4 of the guide. To perform this operation on a standard PC in a single day (due to the necessity to perform the analysis in the presence of several persons) a large amount of preparatory work was needed to simplify and optimize the script. The analysis generated several files, containing all the information needed to generate the final tables now shown in the guide. Those files were saved and are all that remain of the data analysis.
To account for the large variations between sources (see Figure 5), the 90th and 95th Percentile values for dissolved gas concentrations, deltas and rates norms were rounded as follows:
1 to 10: No change |
|
500 to 1000: 100 |
|
10 to 50: 5 |
|
1000 to 2500: 250 |
|
50 to 100: 10 |
|
2500 to 5000: 500 |
|
100 to 250: 25 |
|
Above 5000: 1000 |
|
250 to 500: 50 |
|
|
|
Furthermore, the values from different age groups were combined in one when they differed by less than 35%. Figure 6 illustrates the final Table 1 [5] of the guide.
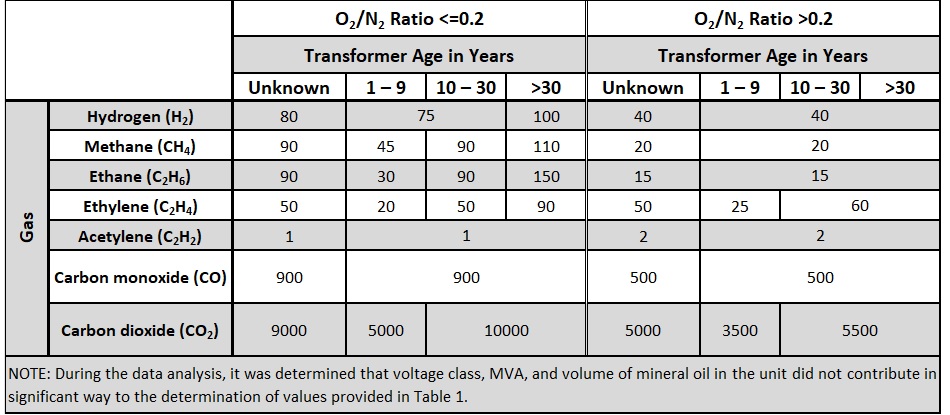
Figure 6. Example of the final result: Table 1 of the new IEEE C57.104TM-2019 "Guide for the Interpretation of Gases Generated in Mineral Oil-Immersed Transformers"
For guide revisions, it should be expected to spend at least as much time in data collection and cleaning as in data processing.

Lesson Learned
For work requiring the collection of large amounts of data from volunteer sources, especially if this data could be commercially sensitive, it is imperative that a legal framework (NDA, waiver, Terms & Conditions of Use, etc.), secure data storage facilities, and accessibility protocols are in place before collecting any data. A standardized form is needed for the collection of the data, noting that a singular date format is especially important. It should be expected to spend at least as much time in data collection and cleaning as in data processing.
Acknowledgement
The authors wish to take this opportunity to thank all participating IEEE C57.104TM Working Group members, data contributors (utilities and laboratories), and their employers, for their confidence and support throughout this lengthy and challenging revision process. Without them, this work would not have been possible.
References
[1] I. Davies, P.J. Burton, "A review of the methods for interpreting the analysis of dissolved gases in insulating oil", Unpublished unclassified report, Central Electricity Generating Board, SouthEastern Region, Scientific Services Department, UK, July 1972
[2] Guide for the detection and determination of generated gases in oil-immersed transformers and their relation to the serviceability of the equipment, ANSI/IEEE C57.104, 1978
[3] IEEE Guide for the Interpretation of Gases Generated in Oil-Immersed Transformers, IEEE C57.104-2008, February 2009
[4] R Core Team. R: A language and environment for statistical computing. R Foundation for Statistical Computing, Vienna, Austria, 2016, URL https://www.R-project.org/
[5] IEEE Guide for the Interpretation of Gases Generated in Mineral Oil-Immersed Transformers, IEEE C57.104TM-2019, November 2019
A Note: The figures and tables are copyright of IEEE and Claude Beauchemin:
Copyright © 2019 by The Institute of Electrical and Electronics Engineers, Inc.

Claude Beauchemin
Claude Beauchemin, OCQ, graduated from Université de Montréal in chemistry in 1976. He has been working for GE Canada (formerly Syprotec) for 30 years where he specialized in the development and application of on-line monitoring of power transformer physicochemical parameters (Hydran and Intellix systems). Claude joined TJ|H2b Analytical Services in 2011 as Director of Technical Development and Director of Quality Assurance. He is IEEE C57.104 WG Chair, member of the IEEE Transformer Committee, CIGRE, CSC, ASTM and the Ordre Des Chimistes du Québec.

Dr. Luiz Cheim
Dr. Luiz Cheim has been working with Hitachi-ABB Power Grids (Transformers) as a Sr. Principal R&D Engineer for a number of years, having over 30 years of experience in the power transformers industry. His major activities as part of a global R&D team are in the development of transformers condition assessment and performance models and algorithms, as well as the development of new sensors and state of the art monitoring technologies. Dr. Cheim is the proponent of the new Hitachi-ABB Transformer Inspection Robot. In August 2018 Luiz was granted the Best Paper Award by the Cigre organization in Paris, Study Committee A2/PS2 on the use of AI/Machine Learning techniques in support of transformer diagnostics. Dr. Cheim has filed for over 20 patents over the last 10 years alone. He has been a member of the IEEE and Cigre since the 1980s and has taken several prominent roles in both organizations. He was appointed as Technical Chairman of two Cigre SCA2 International Colloquia, in Moscow 2005 and Shanghai 2015, respectively.