


TRANSFORMER MONITORING
Correlative analyses and data analytics are gaining more importance as they enable users to evaluate the probability of failure by using different parameters, which can be supportive or contradictive to each other in their individual failure mode assessment. Once a potential incipient fault has been identified, a set of actions for rectification needs to be determined.
Introduction
The changes in global energy politics, motivated by multiple reasons, have driven the electrical power industry not only to devising more efficient solutions, but also to an increased use of renewable energy resources. Energy production today has become more decentralized with renewable energy being generated regionally, away from the main consumers. The decentralized power generation meant that electrical networks needed to be reconfigured. The electrical energy today needs to be transmitted over longer distances from generating stations to the consumers. Reverse electrical energy flow can happen and it needs to be controlled, placing an additional burden on electrical network components.
With these higher complexities and the requirement to increase the speed and reliability of asset health assessments and maintenance decisions, the collection of condition data and the translation into actionable data becomes more essential. This all happens under the thread of climate change and is therewith connected to more sever climate conditions which have been proven to test the resilience of the electrical energy network even further.
Transformers as a key asset of electrical networks receive special attention regarding condition and risk assessment based on availability requirements. Offline condition assessment methods are established and used for decades with success but require an outage to be able to perform them. Nevertheless, they give a momentary screenshot of the asset at the time of the measurements, so the development of incipient faults can be missed between outages.
Introducing online monitoring in the past was most often limited to some independent parameters or basic trending. Users struggled accessing the true overall condition of an asset. Typical statements were and still are “I got an alarm, but what does it mean to my asset? What are the actions to mitigate an immediate thread?”. In a lot of cases confusion prevailed over clear decisions. “False alarms” lead to a lack of trust in the installed monitoring solutions.
To efficiently assess the condition of a transformer and to convert the data into actionable information, the failure mechanism, its associated monitoring parameter(s) and the dedicated analytic model must be known and considered in their entirety. Correlative analyses and data analytics are gaining more importance as they enable users to evaluate the probability of failure by using different parameters, which can be supportive or contradictive to each other in their individual failure mode assessment.
Correlative analyses and data analytics enable users to evaluate the probability of failure by using different parameters, which can be supportive or contradictive to each other when used individually in failure mode assessment.
Once a potential incipient fault has been identified, a set of actions for rectification needs to be determined.
Analytic Models – Creating Information Instead of Data
The knowledge of failure statistics, problems and failures of a particular transformer fleet, and an understanding of failure mechanisms combined with criticality analysis are essential to choosing the right parameter for an assessment and building up analytic models. Today asset assessment will be mostly understood as a tool to prevent failures and enable Condition Based Maintenance (CBM). But online condition assessment could also be a powerful tool for asset operation. The prediction of a certain load condition and the risk status of electrical assets can be used for dynamic loading. As the pressure on the owners regarding financial efficiency increases, dynamic loading becomes more and more important.
Presenting “only” the data and trending can be misleading, leading to poor maintenance and/or operational decisions and unnecessary interventions, which usually have the potential to introduce new risks. Figure 1 illustrates this scattered data approach and how it often fails. In many cases users find it difficult to analyze scattered data. Data are analyzed separately ignoring the possible relationship to other parameters or even legacy data.
A practical example is partial discharge (PD) measured on a transformer bushing tap. Considering only the detected PD could lead to the decision to further investigate and perhaps open the transformer trying to find the failure. Since the source of PD can be the overhead lines or the bushing surface, it would be necessary to consider the possibility that the discharge originates from outside of the transformer. Appearance and disappearance of PD for longer periods, mostly related to climatic conditions, is a clear sign of external discharges (e.g. surface discharges on the surface of the bushings or corona discharges on the overhead lines). At first sight this example might seem very basic, but it is one of most common problems in terms of PD monitoring on the bushing tap. It would need a lot more parameters than just the PD from the measuring tap to be able to distinguish between internal and external origins of PD.
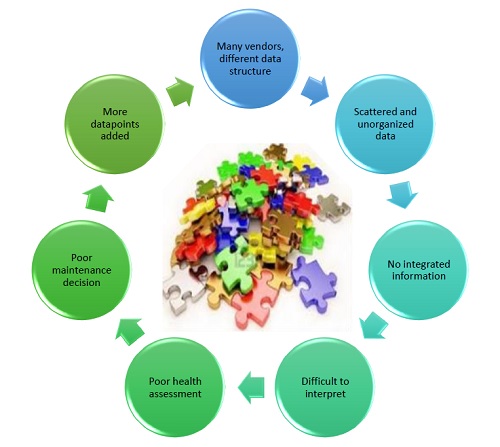
Figure 1. Scattered data approach
Besides reliable capturing of the data for the chosen parameters, it is also important to extract the relevant information. Using the PD example again, this means that PD impulses must be related to their position in the phase of the line voltage, which then allows to combine the single impulses to different pattern types (PRPD pattern – phase resolved partial discharge pattern, 3D pattern, point of wave, etc.). Adding the time of occurrence will also provide additional information for PD analysis. For example, comparing additionally the time of arrival or/and amplitudes of the same PD impulses at different sensors will give further useful information about PD origin. Figure 2 shows how the collected data can be analyzed through different abstraction levels (analyzed by simple logic or sophisticated artificial neuronal network approaches, fuzzy logic, etc.) and further verified with the help of other related data (e.g. PD and Dissolved Gas Analyses (DGA) for transformers).
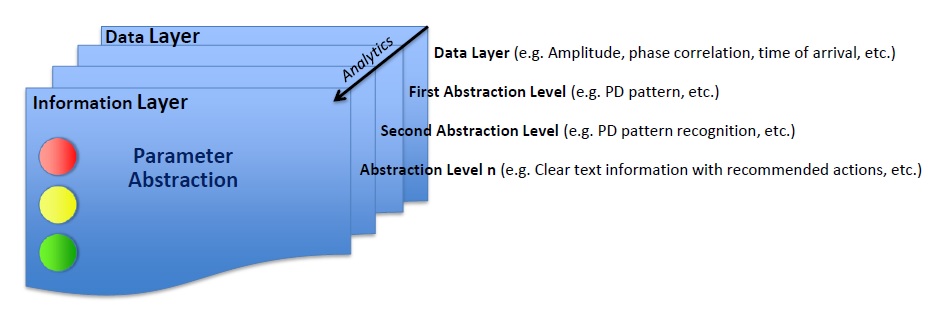
Figure 2. Data abstraction level concept
The abstraction level can be arbitrarily continued. Figure 3 shows the abstraction level at the network layer (top left picture) and the substation layer (top middle) for the substation under concern.
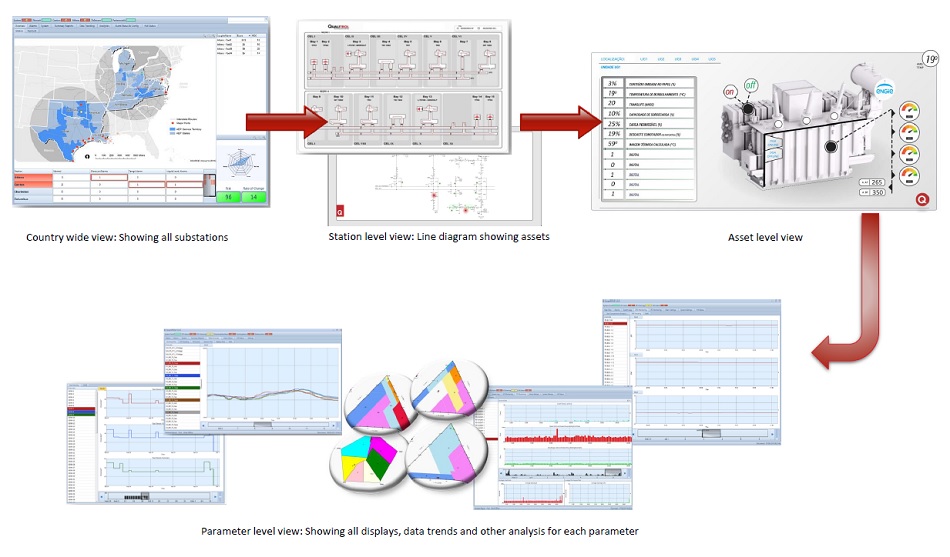
Figure 3. Information abstraction from network to substation and down to parameter level view
To assess a certain alarm or warning condition, different parameters should be correlated to each other, including online and offline data, as well as data from different sources, e.g. SCADA systems, periodical visual checks, load data, etc. This would allow correlation of complementary parameters. Automated correlation of data can be done for online data. Available offline data has often been reviewed manually but seldom automatically via an interface uploaded to an analytical tool or platform which has the analytic ability to marry online and offline data and convert these into actionable information for operators and maintenance crews.
Failure Statistics, Asset Components and Failure Mechanisms
Failure Statistics
The latest transformer reliability study, published in CIGRE Brochure 642 [2], shows that windings are the major cause of transformer failures with 45%, followed by tap changers with 26%, bushings with 17% and lead exits with 7%. All other major transformer components play a minor role (see Figure 4). The overall transformer failure rate according to [2] is 0.44%, while transformers for extra high voltage (EHV) and the lower end of high voltage are showing a failure rate of around 1%.
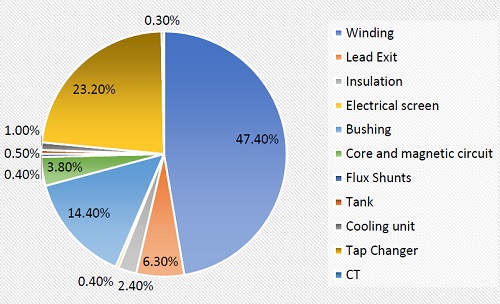
Figure 4. Transformer major failure statistic [2]
Asset Components
All transformer incipient faults will somehow result in the creation of detectable signs of their presence. These signs could be chemical, electrical, optical, or acoustic in nature, but often they will be a combination of these. Further, a selection of possible fault mechanisms related to certain components will be described as simple examples to illustrate the potential of certain parameters to be used as indicators of incipient faults.
Transformer Main Tank
The main concern regarding the transformer main tank is the dielectric integrity of the liquid, bulk and paper insulation, as well as their accelerated aging by local and general overheating and moisture. This is tightly connected with the risk of bubble creation at high moisture and dissolved gas content combined with high temperatures. Moisture and overheating will accelerate the aging of the cellulose. This will create decomposition products of the cellulose, among them water (moisture), which in turn will accelerate its aging even more. Over time, the insulating paper will lose its insulating and mechanical properties until it cannot withstand any electrical or mechanical stress, increasing the probability of transformer failure in the event of voltage transient or through fault.
Loose parts, sharp edges, delamination of bulk insulation, conductive particles in oil, bad contacts and gas bubbles in oil all have the potential to weaken the liquid and solid insulation system and to create partial discharges (PD) and arcing. Strong discharges as a result of these defects can decompose the oil/paper insulation and/or erode the conductive material.
Further failure can be caused by local overheating and burnings due to bad contacts, by circulating core ground current or bad or missing connections from core to ground and from magnetic or electric screens.
Transformer LTC
Load tap changers (LTCs) are the only part in a transformer that actively mechanically operate. Wear and tear of the mechanical parts and contacts can influence the ease of movements. Parameters like liquid temperature difference between the main tank and LTC compartment, DGA, motor drive torque, motor drive current index, operating time, contact wear or vibro-acoustic signature can be a good indicator to detect any abnormalities.
Transformer Cooling System
The main concern regarding the cooling system of a transformer is to ensure the oil and air flow through the coolers/radiators is always guarantied. This can be done by natural convection for smaller transformers or, in case of larger power transformers, by a forced cooling system. In oil forced cooling system pumps are used to circulate the oil through the radiators/coolers and fans are meant to circulate the air through the radiator fins and cooler rips to take the heat away. More complex systems are using water to cool the oil. In that case pumps are also circulating the water. If the cooling system is disturbed by malfunctions of fans or pumps, the oil and thus the transformer cannot be cooled down in an appropriate way, which can lead to overheating and transformer failure. Changes in the relationship of inlet and outlet temperatures of the cooling banks or changes of motor load currents, fans and pumps can support an early detection of malfunctions. In a simplified approach, the top and bottom oil temperature correlation with the actual load condition can give a rough indication of a severe condition as well.
Transformer Bushings
Bushings are components that guarantee the transport of the electrical energy (voltage and current) into and out of the transformer from and to the electrical network. For higher voltages mainly above 36 kV (for generator step up units and also high current bushings of 24 kV and 36 kV) capacitor type bushings are being used. The major causes of failure in bushings are moisture and partial breakdowns (breakdown between two or more conductive layers of the bushing insulation). Partial breakdowns are mainly caused by transient overvoltages or pre-deterioration due to partial discharges. Leakages on porcelain sealings especially in case of oil impregnated paper bushings (OIP) are responsible for moisture ingress. Meaningful indicators to look for here are the Power Factor and the Capacitance Considering catastrophic failures, according to [3], bushings are in 70% of the cases the cause, there are other components leading the transformer to fail but with less risk of a catastrophic failure.
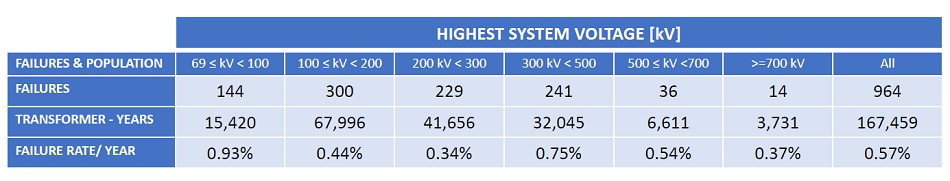
Table 1. Transformer failure statistic [2]
Analytics and Correlative Analyses
Analytics is concerned with finding meaningful patterns based on input data, existing static models (like formular/calculations) to dynamic models (like machine learning data analytics) and converting it to a useful output. Correlative analyses can be part of the analytics or in a simpler way a standalone technique, combining information based on different parameters and from different sources. Both are using abstraction algorithms. The bubbling temperature model, which calculates the temperature for bubble evolution based on existing static model (formular) is an example of a simple static analytic model. It is used to determine the temperature at which the gas bubble generation starts. To enable this calculation, a set of different input parameters needs to be known, like the hot spot temperature, moisture in oil, gas content in oil, pressure at the hot spot, temperature of the oil at the moisture sensor and the ambient temperature. A more sophisticated approach is the artificial neural network-based PD pattern recognition as shown in Figure 5.
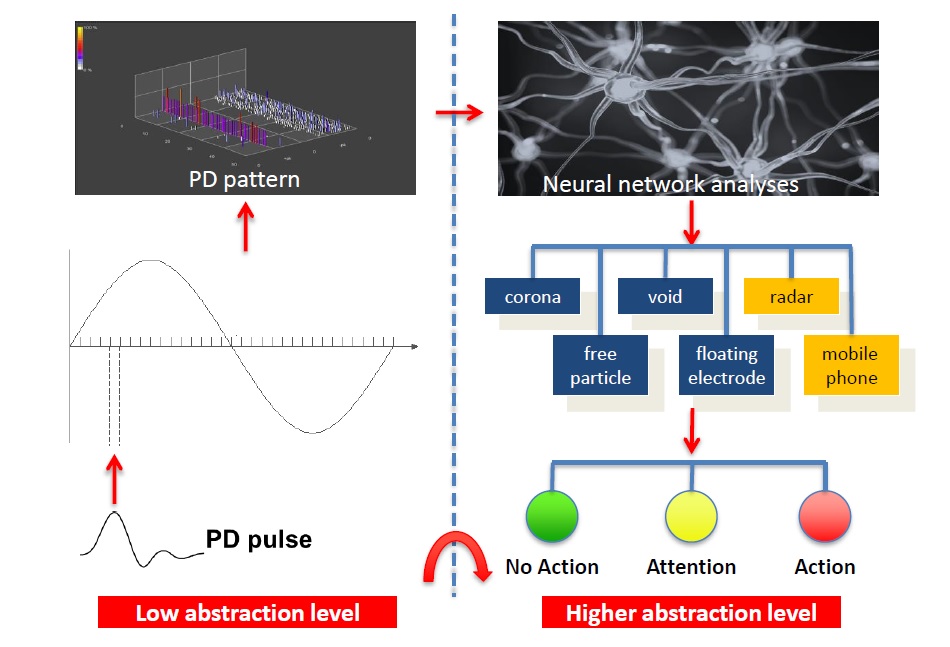
Figure 5. PD pattern recognition on PD data abstraction process
Correlative analyses, instead, aim more at the “if…then….” approach (Figure 6). For example, if the detected moisture value in the transformer is higher than usual, this can be caused by different reasons. Reviewing the site visit reports shows that some oil drops have been discovered on the sealing of the transformer. That can be translated to “If moisture has been detected and oil drops (signs of leakage) can be discovered, then there is a severe oil leak which influences the condition of the transformer”. Similar approaches can also be taken between PD activity and DGA, PD activity and core ground current, etc.
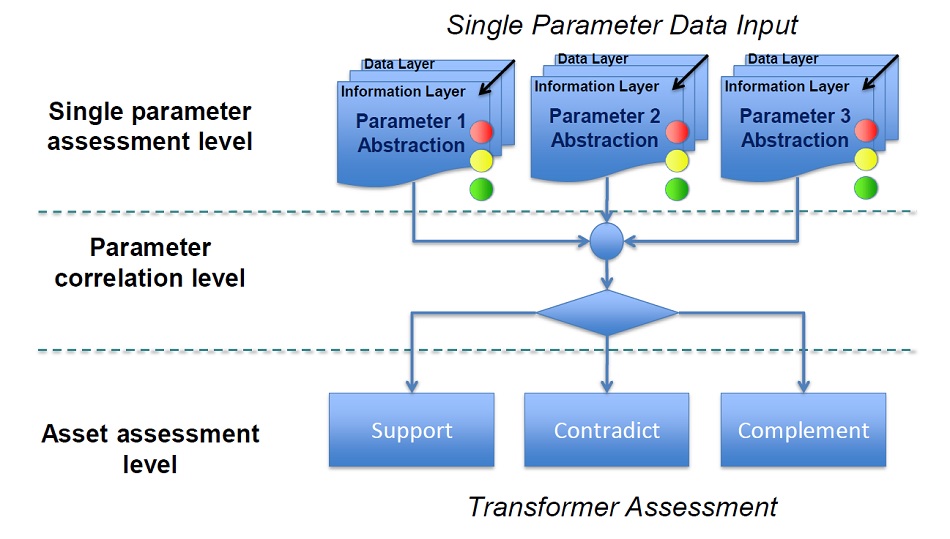
Figure 6. Overview correlative analyses
Table 2 shows an example of correlative analytic models for failures in the magnetic circuit considering different parameters and its detection time.
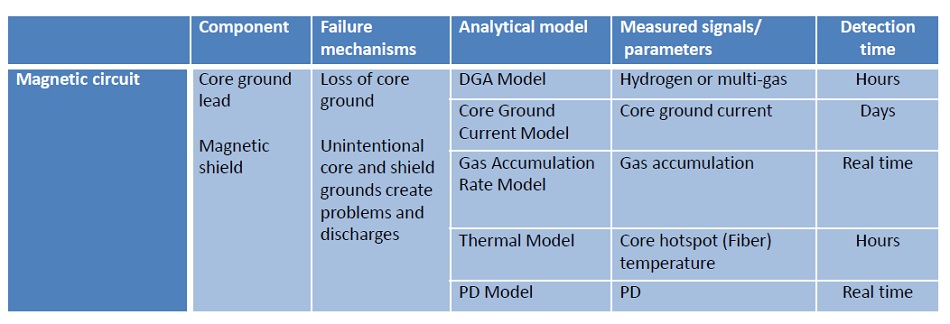
Table 2. Magnetic circuit correlative analyses
Five different analytic models shown in Table 2 are readily available. For each of the models different input parameters need to be gathered and each of the models/parameters has its own detection time. It is useful to use more than one analytic model for a certain failure mechanism. In the above example most probably the DGA model, the core ground current model and the PD model would be the best fit. In that case the parameters to measure are dissolved gases, PD and the core ground current.
Similar models are made for different kind of failure mechanisms in the transformer main tank, LTCs, bushings, cooling systems, GIS, etc. Regarding the importance of that particular asset and its history a decision about the types of failure mechanisms needs to be considered for monitoring.
Practical Example
In this case a single phase, extra high voltage (EHV) autotransformer was equipped with a comprehensive monitoring package including DGA, UHF PD, bushing, and temperature monitoring. The transformer had been three months in service and experienced a catastrophic failure. DGA and bushing monitor did not alarm, but the PD monitor showed strong PD activity eight hours before the fault occurred. This shows that correlative analyses not only support or contradict each other, but also can complement each other as seen in this case. One method, the UHF PD, was able to detect the change of condition in real time, while one of the other two methods, the DGA, was too slow due to the time needed by the generated gasses to dissolve in the oil [5]. The utility did not have experience with the UHF PD monitoring and was not expecting this new transformer to fail. It decided to observe the PD behavior before setting thresholds to activate alarms, therefore, the UHF PD monitoring system was not connected yet to their Scada System and the failure was not detected. After this experience, the utility applied the history data to stablish PD thresholds and was able to detect this type of behavior in similar transformers and avoid catastrophic failures.
Using analytic models and correlative analyses allows users to make reliable decisions about their assets, increasing the confidence in transformer health assessments and allowing the use of complementary models.
Conclusion
The power industry today demands, besides the conventional transformer gauges and well established online DGA applications, a more comprehensive condition assessment approach to implement condition based monitoring principles, to make transformer operation more efficient and optimized, as well as to be able to detect incipient faults in an early stage.
The demand for analytic models, which allow users to make reliable decisions about their assets, is exponentially increasing. Using correlative analyses increases the confidence in transformer health assessments and will allow the use of complementary models.
References
1. S. Beneyto, J.Vantyghem, “Discussion on the deregulation of electricity markets,” Mines ParisTech, http://www.energypolicyblog.com, [Online] 06 06, 2010. [Cited: 01 20, 2014] http://www.energypolicyblog.com/2010/06/06/discussion-on-the-deregulation-of-electricity-markets/
2. CIGRE Brochure 642, Transformer Reliability Survey, Working Group A2.37, CIGRE, 2015
3. H.-P. Berg, N. Fritze, “Reliability of main transformers,“ Salzgitter, Germany, Bundesamt für Strahlenschutz, 2011
4. 57.91, IEEE WGC, IEEE Guide for Loading Mineral-Oil-Immersed Transformers and Step-Voltage Regulators, s.l.: IEEE, 2011. IEEE C57.91-2011
5. C. Schneider, “Lessons Learned from Failed Assets at EHV,” Conference on Online Monitoring of Electric Assets (COMET) 2014, Austin TX

Emilio Morales
Emilio Morales attended Nuevo Leon State University in Mexico, receiving his bachelor’s degree in Electromechanical Engineering in 1980. He has over 30 years of experience in power transformer design which includes transformers up to 500 MVA and 500 kV, furnace and rectifier transformers and reactors. He is member of the IEEE/PES Transformer Committee, IEC and CIGRE. He previously worked with GE-Prolec, Ohio Transformer, Sunbelt Transformer and Efacec. He joined Qualitrol in June 2012 as a Technical Application Specialist in transformer applications. His focus is to support solutions in comprehensive monitoring for transformer applications.