


Diagnostics to determine the status of a device have gained considerable importance in recent years for many reasons. Both technical and economic aspects play a major role. In the case of electrical energy supply devices, the focus is, among other things, on the diagnosis of the insulation system, as this largely determines its service life. Knowledge of the operating conditions, the parameters, and their effects on the insulation system are necessary to meet the diagnostic requirements. The parameters can be obtained offline or online. This article will discuss data from offline measurements and associated diagnostic procedures and their importance.
Introduction
Diagnostics, as originally defined, means the ability and teaching of recognizing diseases - strictly speaking, it is the process of determining which disease or condition explains a person's symptoms and signs. In the technical field, diagnosis is associated with the term examination and the monitoring procedure with which the condition of a device or its components is determined. Sometimes including additional suggestions for measures that may be necessary. In the field of electrical power engineering, diagnosis has a much higher priority today. The desired change from previous time-based maintenance of the system to condition-based maintenance of the system requires better knowledge of the most important parameters of the system to be able to take appropriate and timely measures. The replacement of electrical energy supply facilities, which in the past was often caused by changes in the voltage level because of an increased energy requirement, is now often delayed if possible due to the increased demands on the economic efficiency of energy supply companies. Diagnostics offers a very valuable tool to evaluate the performance of existing systems and to assess the risk in terms of reliability and probability of failure. The partial redundancy of the devices is no longer maintained in the same way, so if a component fails, consequential damage occurs that can cost far more than a new one.
The technical possibilities and the costs for the collection of measurement data and their storage as well as transmission to the corresponding control centers have changed significantly in recent years so that the collection and storage of measurement values do not represent a significant economic factor, but rather the task of what the data tells us and how the issue should be solved intelligently. The improvement of mathematical tools and the development of new evaluation and prediction methods have also led to an increase in diagnostic options, the use, and efficiency of which still must be tested in operational practice. The economic boundary conditions of the electrical energy supply will lead to an increasing load on the existing systems in the next few years, the age of which is increasingly approaching the "mature" age, as shown in Figure 1 representative of the transformers of a Central European energy supplier company.
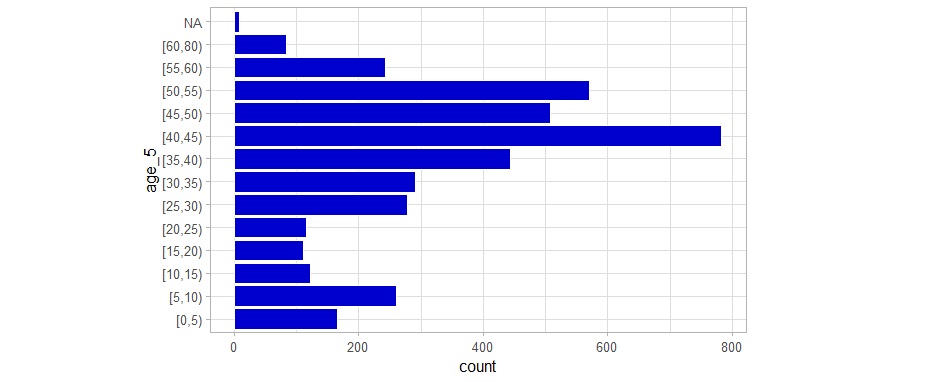
Figure 1 Average age of the transformers in the grid supply company - as an example for any middle European region
All these economic boundary conditions and increasing load have led to significant research growth in the field of diagnostics, sensors, and processing methods, and from a large number of good ideas, the best ones are proving themselves in practice now.
In the laboratory dielectric-chemical analysis according to IEC 60422 (Mineral insulating oils in electrical equipment - Supervision and maintenance guidance), the aging condition of the oil-paper insulation system is determined from key figures of the insulating oil. The breakdown voltage enables a statement to be made about the current insulating capacity of the oil. The neutralization number (TAN – total acid number) and the interfacial tension are very sensitive indicators of the oxidation state of the insulating oil and the aging of the entire oil-paper insulating system. They are early indicators of sludge precipitation. An increased water content (Wc) drastically worsens the insulating properties of the oil and accelerates the aging of paper and pressboard.
For example, the functional diagram can show a graph of the relationship between many of the oil variables that are examined according to IEC 60422 – Figure 2. This is derived from the fact that in datasets with many variables, groups of variables often move together. One reason is that there can be more than one variable measuring the same “driving principle” that determines the behavior of the mineral oil/electric system. A multiplicity of laboratory equipment makes it possible to measure and display dozens of system variables simultaneously. In this case, we can use this informational redundancy very well to determine the oil parameters and their “driving forces” behavior – Figure 2.
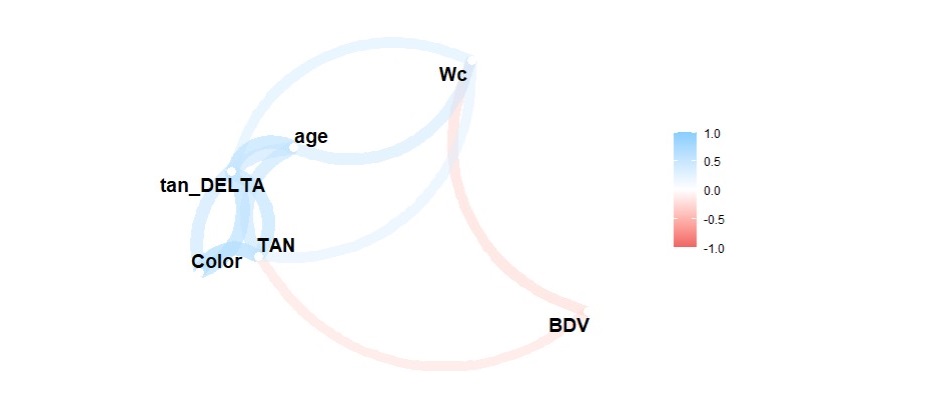
Figure 2 function chart graph of the relationship between many of the oil’s variables. The color bar shows the correlation coefficient between all the variables
Objective of the diagnosis
The aim of the diagnosis is to offer support and expertise to meet the requirements for an economical, stable, and trouble-free electrical energy supply. Strictly speaking, it is about achieving the best possible electrical energy supply with minimal effort. What does that mean in everyday operation? This means that a prognosis for the future in terms of reliability, failure probability, and expected service life should be made from the data recorded by laboratory measurements in the past and the detailed knowledge of the properties of the devices. Such a statement must be made for a single device or for a group of devices or even an entire substation, depending on the cost of the device in question, as well as its maintenance and service. For example, because of their large number, medium-voltage equipment needs to be treated differently than high-voltage equipment, and the impact of a failure on this equipment can be very different, sometimes even very dramatic and grievous.
Let’s take the data from a high-voltage transformer presented in Figure 2, as an example of the task and goal of the diagnosis. Based on several thousand laboratory data sets, we were able to show that it is sufficient to measure only two of the parameters described in order to assess the BDV value - since there is a strong correlation between Wc, TAN, and BDV for mineral oil-based insulating liquids as shown in Figure 2, acid and moisture are the "driving forces" of BDV. It is known that the water content influences the properties of solid insulation materials, but Wc cannot normally be measured directly during operation, since Wc measurement needs e.g., KF-Titration. The moisture in the solid insulating material can be determined from the moisture measurements of the liquid under known conditions, so that information about the development of the moisture in the solid insulating material can be obtained due to the established model by continuously determining the moisture in the liquid, see Figure 3 [1, 2].
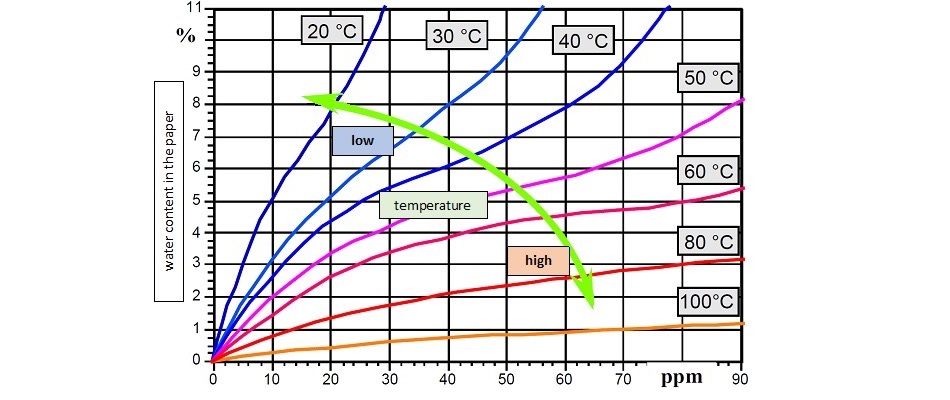
Figure 3 Moisture distribution in a paper/liquid insulation as a function of the oil temperature
Basics & Operating Conditions
Today, paper gets its structural stability from the use of cellulose fibers made from the primary cell wall of green plants. To keep the paper stable during and after production, for example, it is treated with potassium aluminum sulfate, one of the substances commonly used in the production process here. This makes the paper weakly alkaline since the potassium aluminum sulfate lowers the paper’s pH, making it acidic. This is desirable in papermaking since this additive primarily improves fiber bonding. However, if the paper is stored for a longer period of time, a lower pH value and ubiquitous moisture will lead to the destruction of the cellulose chains, as these are linked by acid-sensitive acetal bridges. This process breaks down the fiber structure of the paper. As the cellulose macromolecules break down into smaller molecular units, the paper in question loses its flexibility and tear strength. This is accelerated by the presence of water and temperature changes. This is called paper decay or “paper corrosion”. It refers to the aging-related dissolution of paper, which is often triggered by the effects of acids present in the material (acid corrosion) but can also be accelerated by external influences.
From this point of view, the parameter changes recorded in the laboratory test can depend very much on the mode of operation of the device, so that evaluating the measured variables alone without taking the operational boundary conditions into account can lead to incorrect statements. Determining the moisture in the liquid and drawing conclusions about the moisture in the solid insulation material is only permissible if the entire insulation system is in equilibrium. With knowledge of the relationship between Wc & TAN (see Figure 2) as well as information on water migration between oil and paper insulation (see Figure 3), the processes observed in the older transformer population now become perfectly clear and understandable.
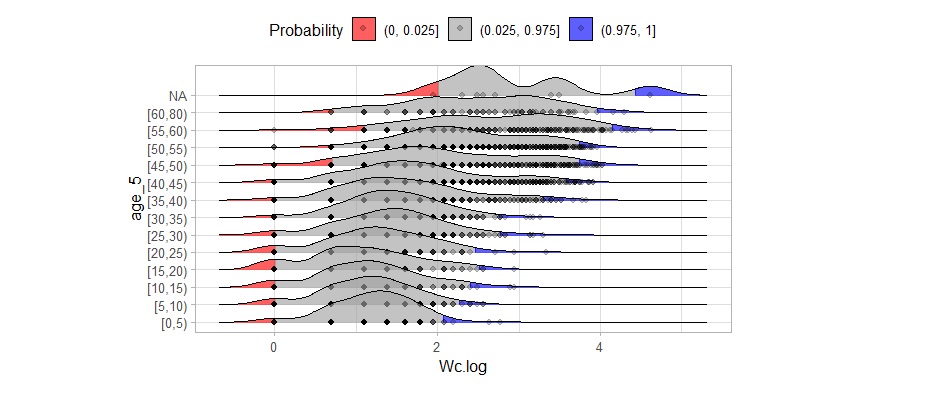
Figure 4 Water distribution in an aging transformer population
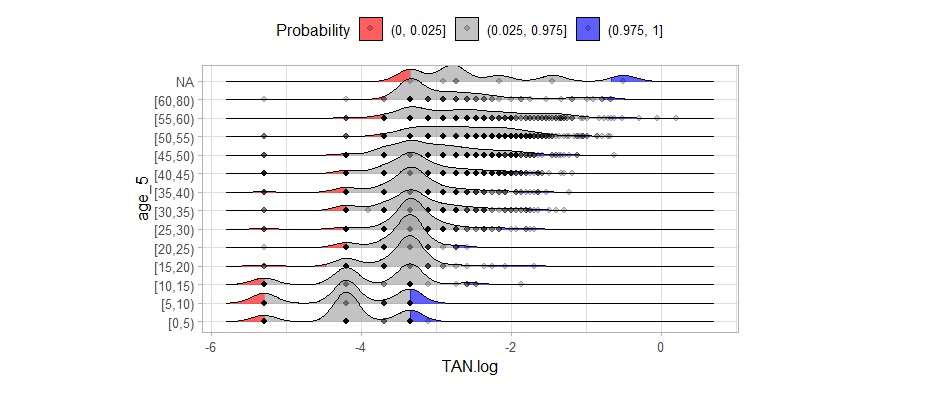
Figure 5 Acid (total acid TAN) distribution in an aging transformer population
Unfortunately, the aging factor accelerates significantly with increasing temperature. At very high core temperatures, meaning over 90°C (190°F), the aging factor doubles with each additional 6°C (10°F). For the aging diagnostics of the paper, this statement also means that it is important to precisely know the temperature in the insulating material, especially at the points of highest temperature (core), since the aging processes experience a very strong acceleration there and lead to local destruction of the insulation and can lead to the device’s failure. Due to a high electrical field strength, the occurrence of partial discharges is usually a very early warning sign for local defects and leads to an increased formation of decomposition gases such as Hydrogen H2. To establish a diagnosis, all of the following factors must be considered: in which insulating material these partial discharges occur, under which boundary conditions, and at which point.
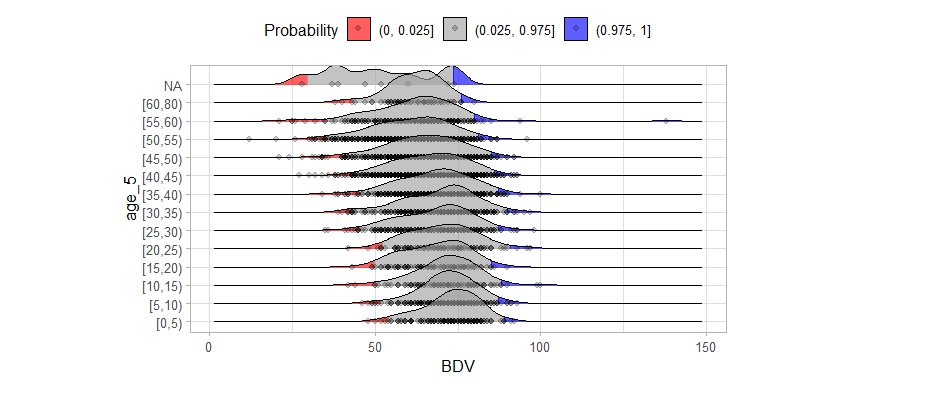
Figure 6 Breakdown Voltage distribution in an aging transformer population
As mentioned above, the presence of free gases in the oil is another important factor. The DGA (Dissolved Gas Analysis) enables a diagnosis of the processes that have occurred in the insulation system, for example, partial discharges, thermal overload, or low-energy or high-energy breakdowns. Figure 7 shows that mineral oils for transformers are mixtures of many different hydrocarbon molecules and the decomposition processes for these hydrocarbons during thermal or electrical faults are complex. The basic steps in gas production are the breaking of carbon-hydrogen and carbon-carbon bonds. Active hydrogen atoms and hydrocarbon fragments are formed. These free radicals can combine into gases, molecular hydrogen, methane, ethane, etc., or recombine into new, condensable molecules.
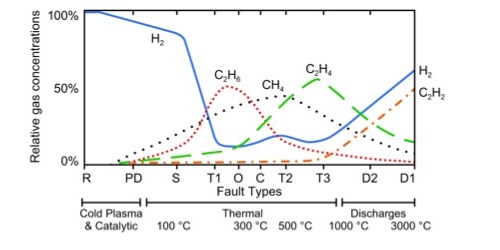
Figure 7 Relative percentage of dissolved gas concentrations in mineral oil as a function of temperature and fault type
The acronyms and abbreviations used in Figure 7 mean:
- R – catalytic reactions,
- PD – partial discharges,
- S – Stray gas formation,
- T1, T2, T3 – thermal
- O – superheating of paper or mineral oil,
- C – possible carbonization of paper,
- D2 – high energy discharges,
- D1 – low energy discharges
The amount of hydrogen produced can be relatively high and temperature-insensitive for some failure types such as stray gas formation, partial discharge (PD), and catalytic failure. The formation of acetylene only becomes noticeable at temperatures close to 1000 °C. Also, the formation of methane, ethane, and ethylene each has a unique dependence on temperature. In addition to the number of gases produced by the processes, the ratio between the gas types is also important. The IEEE Guide for the Interpretation of Gases Generated in Mineral Oil-Immersed Transformers provides a very comprehensive overview of this topic [3].
The measurement of the dissipation factor tan δ is primarily an assessment of the losses in the insulation system and is therefore not predominantly a diagnostic procedure. However, the change in the loss factor over time is an indication of aging and thus of the change in the insulation system, so some diagnostic parameters can be derived from this. It is amazing how the tan δ correlates with the changed Wc and TAN profile. Please compare Figures 4, 5, and 8. The X-axes in all of these images use the logarithmic scale to highlight and emphasize the changes over time.
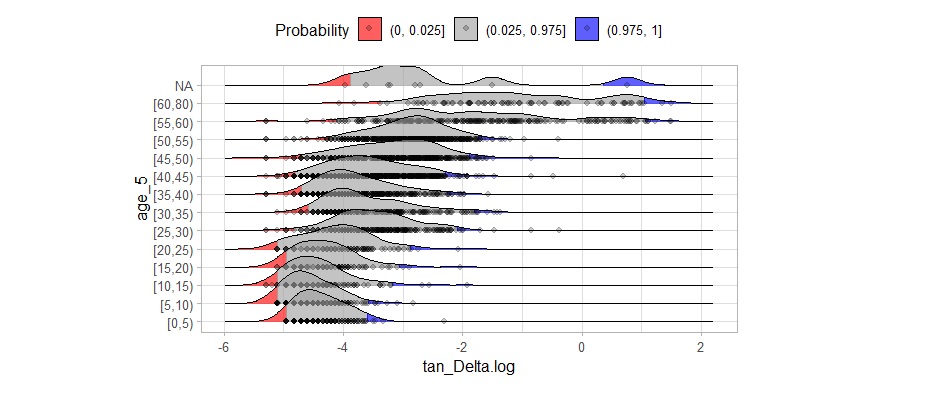
Figure 8 Change in dissipation factor tan δ in an aging transformer population
Modern measurement technology and data processing as well as data storage enable the recording of many parameters that contribute to the monitoring of an electrical system. The mathematical methods for evaluating measurement results range from simple comparisons to various statistical models and methods of artificial intelligence. From the wealth of information available, it is now a matter of selecting the most important ones and recording them systematically, as well as understanding the consequences that the data contain. It should be noted that these consequences depend very much on the respective insulation system. Is it just a single and isolated device or a group of devices or even a whole substation as recently announced? The results of this statistically supported evaluation, the importance of which is constantly increasing due to the increased use of diagnostic systems and field sensors as well as the increasing knowledge of basic research, must then be transferred to a risk and cost analysis. However, the risk analysis should also consider the following factors and the costs: Costs for a complete replacement of the device, costs for condition-based maintenance, costs for unforeseen events and longer downtimes, and costs for consequential damage. These factors then define the costs of a diagnostic system and the possible sensors and their use. Given these conditions, a simple conclusion can be drawn. The diagnostic results to be expected regarding the assessment of the insulation systems must bring a recognizable economic benefit for the operator of these diagnostic systems. For devices with a high purchase price, which is often associated with long delivery times, and for strategically important devices, the costs for diagnosis can be higher than for devices with a lower purchase price and importance. However, the importance of a device is not only determined by its price but also very much by its place of use and the consequences associated with its failure, whereby the assessment of the importance can change very quickly here, e.g., due to changed legal framework conditions, insurance requirements or simply the possible delivery times.
Diagnostics is a decision-making factor in maintenance and asset management and can provide significantly better information about the condition of oil-insulated electrical systems with the online and real-time monitoring devices and methods available today. A sensor for oil temperature, water content Wc, breakdown voltage BDV as well as hydrogen H2 and carbon monoxide CO content can be regarded as the best and most sufficient "first line of diagnostic defense".
This applies to all systems that work with a liquid insulating agent based on mineral oil (and/or GTL based). Further studies must show whether this also applies to ester oils.
[1] Y.Du et. all, “Moisture Equilibrium in Transformer Paper-Oil System”, IEEE electrical Insolation Magazine Vol. 15, No. 1
[2] E.T. Norris, “High Voltage Insulation”, Proceedings IEE Vol. 110, No.2
[3] IEEE Std C57.104TM-2019, “IEEE Guide for the Interpretation of Gases Generated in Mineral Oil-Immersed Transformers”

Miroslaw Wrobel
Dr. Miroslaw Wrobel received the M.Sc. degree in applied physics from Silesian University of Technology, Gliwice, Poland, in 1993. He received his Ph.D. degree from the Institute of Fundamental Technological Research, Polish Academy of Sciences Warsaw, Poland. He pursued his Ph.D. research in the area of medical physics focusing on molecular acoustics. He worked on non-invasive medical diagnostic and imaging techniques as a visiting fellow at the Defence R&D Canada, Toronto (previously known as DCIEM) of the Canadian National Defence. Since 2005, parallel to his medical research, he has been working on the application of acoustic and optical sensing method in high-voltage technology. He holds several patents in the field of medical diagnostics and monitoring of industrial plants.


 Security in Substations")