

ASSET SOLUTIONS: by Tony McGrail
Foreword from the Editor in Chief
I first met Tony McGrail several years ago at a Doble Life of a Transformer Conference. In fact, I did not meet him face to face, I was in the audience at a presentation he gave. It was later that we actually met, but the thing that struck me at that conference was his tremendous technical and experiential knowledge. When we asked Tony to write under his own Byline for us in the Transformer Technology Community, it was with the freedom to write about what interested him and what he thought would be of value to our community. This is his premier contribution, so I hope you enjoy it as much as I have.
Introduction
Bushings are usually reliable elements of any electric supply system, but all bushings have failure modes and all bushings will eventually fail: some relatively slowly, over weeks or months, and some relatively rapidly, over hours [1]. The cause of failure could be a combination of factors such as moisture ingress, the effects of transients, and insulation deterioration. The result is a reduction in the capability of the bushing insulation: power factor (tan delta, dissipation factor) and capacitance may increase, which can be detected through both offline and online measurements. In this paper we review the differences between the results of offline bushing testing and online measurements using both relative and true power factor techniques. We must understand the nature and practicality of offline and online approaches to understand why the results may differ and the value they bring in preventing bushing failures.
Bushings – Offline Tests
A bushing allows a current carrying conductor to pass through a barrier, which is usually grounded, such as a transformer tank. As the insulation on a bushing is not perfect, the voltage on the conductor will produce a current through the bushing insulation to ground, known as the leakage current, as shown to the left in Figure 1. Measuring the phase angle between the applied voltage and the resulting leakage current allows us to calculate the loss angle, power factor, and capacitance of the bushing insulation, as shown to the right in Figure 1 [2].
Offline testing of bushings has been performed for many years, with standards such as IEEE C57.29.01 supporting the interpretation of data and providing limits for acceptable results [2]. Each bushing should be factory tested, deriving a ‘nameplate value’ for the key parameters – power factor and capacitance. Field test results are compared to the nameplate and are trended over time to indicate levels of deterioration [3].
Analysis of field results using statistical tools helps identify outliers and anomalous results for bushings which may be at early stages of incipient failure: but we must compare an individual bushing with similar bushings in terms of manufacture and design as results from different bushing ‘families’ may be very different [3, 4].
We must understand the nature and practicality of offline and online measurement approaches to understand why the results may differ and the value they bring in preventing bushing failures.
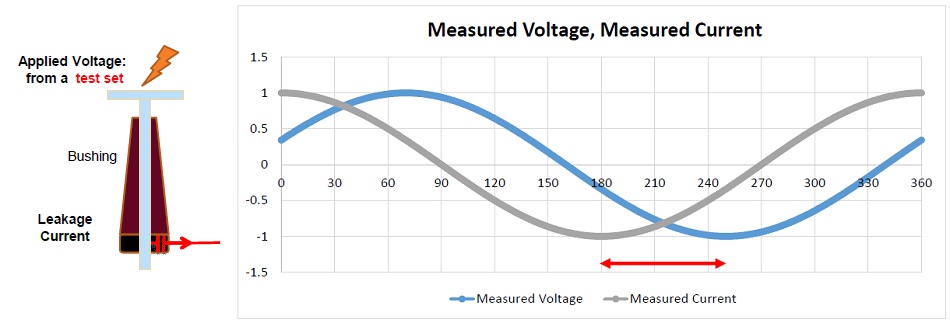
Figure 1. Offline test overview for bushing power factor and capacitance
In an offline test the voltage is supplied by a test set and is precisely controlled and measured; the resulting leakage current is also precisely measured. These two key parameters are thus well defined and accurately evaluated. In addition, the test object – the bushing – is well defined and consists of everything between the point of voltage application and the point of current measurement. Given accurate measurements of current and voltage we can then calculate the bushing power factor and capacitance precisely.
Online Measurements – Early Days
Failure modes of bushings may act over timescales much shorter than the interval between regular offline testing – meaning that incipient failures are missed and possibly catastrophic bushing failures result. The benefit of an online system to monitor bushing condition is clear – prevention of failures, which would otherwise go undetected until the bushing fails [5].
One early approach was to look at the three-phase sum current as a detector of deterioration. The symmetry of a balanced three-phase system means that when the three sinusoids are added they will sum to zero at any point in time. For the three leakage currents for a set of identical bushings, any non-zero sum could be an indicator of deterioration in one of the bushings: this would be a detector, rather than a diagnostic, as we don’t know which bushing is the cause of the non-zero sum, or whether it is a current magnitude or phase variation. In the late 1990s and early 2000s such approaches were used to identify anomaly, but electric supply system variations could lead to too many false positives: minute-by-minute the voltage on each phase is not identical in magnitude across the three phases and the expected 120° phase difference was rarely found.
The sum current data for a HV set of bushings on a large power transformer is shown on the left in Figure 2; the data covers recordings at 1 minute intervals over 24 hours and is not only non-zero, it also shows phase variation over time which could indicate an incipient failure related to power factor. In fact, this would be a false positive as the raw data, the rms currents and phase angles, are normal for this bushing set. The charts at right in Figure 2, cover the same time period as the sum current and the variations seen in rms current and phase are typical and reflect the individual application of the bushings [3].
It was the tendency to provide too many false positives which led Doble to move away from sum current as a detector almost 20 years ago, and move to actual power factor data and capacitances for each bushing.
The benefit of an online system to monitor bushing condition is clear – prevention of failures, which would otherwise go undetected until the bushing fails.
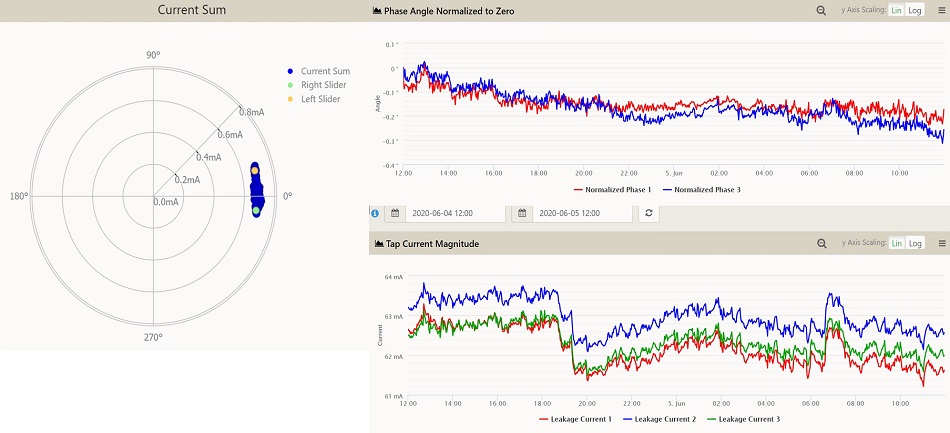
Figure 2. Sum Current Chart for a 650 MVA transformer
Online Measurements – Relative Power Factor
We must note that a key difference between online and offline measurements: in online measurements we do not supply the voltage, and must find a way to measure it, or account for it, which is what happened initially with ‘Relative Power Factor’. The approach is to measure the three leakage currents, as shown in Figure 3, and calculate the phase difference between each pair of bushings.
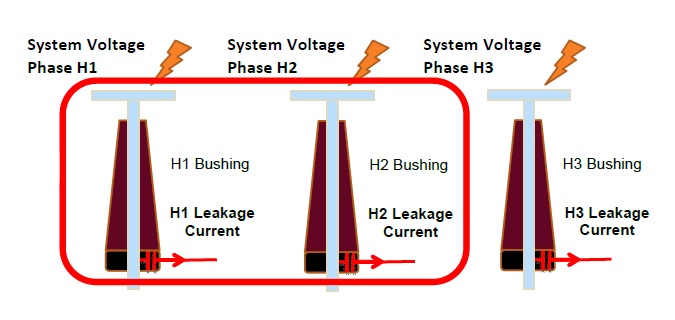
Figure 3. Relative Power Factor basic measurements
We are interested in power factor and capacitance, but we must start with the basic measurements: the raw waveforms at each bushing test tap, as shown in Figure 4, as these are what we use to determine the leakage current rms and phase values. We would theoretically expect a pure sinusoid at each tap, but this is not often the case. The data in Figure 4 shows the three HV bushings, to the left, and the three LV bushings to the right, all of which contain harmonic content.
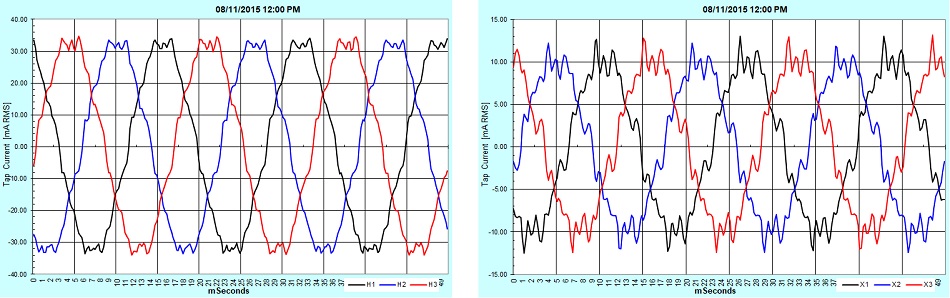
Figure 4. Raw waveforms at a windfarm transformer
The curves in Figure 4, for a transformer at a windfarm location, show the actual signals are neither pure sine waves nor equal in magnitude. The recordings are used to calculate the actual system frequency – which is usually close to but not exactly equal to 50 or 60 Hz. An early approach to determine waveform frequency was to count zero crossings, but this could lead to incorrect results as harmonic content means more crossings may be counted than are present at the fundamental system frequency. A far better method is auto-correlation of the sinusoid, followed by digital power sinusoid generation and cross correlation, which has the benefit of also giving the harmonic content of the raw waveform.
Once we have the raw waveforms we can accurately calculate the key initial values, which are shown in Figure 2: current magnitudes and relative phase. In practice, all three currents have a phase angle measured against an arbitrary time reference given by the data acquisition system. These angles are used those to calculate the relative phase angle between any two bushings; the phase angle chart in Figure 2 shows just two values as the third value is always 360° minus the sum of the two given, as A relative to B, B relative to C and C relative to A will always add to 360°.
In Figure 3, we can measure the relative phase between H1 leakage current and H2 leakage current: this relative phase angle will be derived from contributions of the two bushing power factors and the phase difference between H1-H2, which is nominally 120°. We can use the three relative values to calculate the power factor of each bushing, noting that variation in system voltage phase from 120° is a significant impact. Capacitance is calculated from the leakage current and nameplate bushing voltage. It is clear from the approach that there are several sources of variation: as can be seen in Figure 2 the voltage on the system is not a constant magnitude, as we can see all three rms current magnitudes changing in unison, and the relative phase is not constant at 120°.
In practice, many of the effects of system variation can be removed by averaging the power factor and capacitance values to remove some of the system-imposed effects. The Relative Power Factor technique has been successful in identifying deteriorating bushings and preventing their failure for more than two decades: relative power factor has saved a variety of bushing types including Trench, GE and Westinghouse and prevented catastrophic failures [3, 6].
A key difference between online and offline measurements is that in online measurements we do not supply the voltage, and must find a way to measure it, or account for it.
As an example, Figure 5 shows the recorded rms currents and weekly power factor for a set of 3 bushings. The variation was such that alerts were triggered for a weekly power factor at 2.5%, compared to a nameplate value of 0.32%. The transformer was taken offline and bushing tests confirmed the deteriorated state of the bushing.
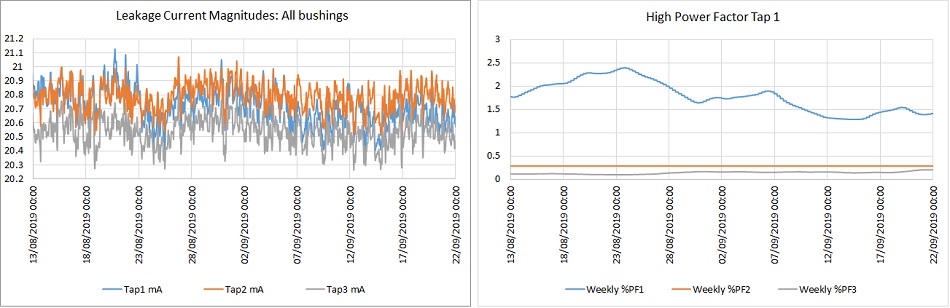
Figure 5. Leakage Current and Relative Power factor for failing bushing
Without appropriate condition monitoring, the true condition of the bushing would have only been found after it had deteriorated to the point of failure. Note that alerts should be able to be set based on instantaneous rms current and phase values, as well as daily, weekly and monthly values.
If a temperature measurement for each individual bushing is available, that should be used to ‘correct’ the resulting power factor and capacitance values for comparison to manufacturer tables stored within the monitor; where necessary, a user should be able to enter correction factors for their individual bushings.
The Relative Power Factor technique has been successful in identifying deteriorating bushings and preventing their failure for more than two decades, saving a variety of bushing types and preventing catastrophic failures.
Online Measurements – True Power Factor
True Power Factor (TPF) is called ‘True’ as it looks at the phase angle between a voltage and a current, by using a voltage reference, as shown in Figure 6, where a bushing and an Instrument Transformer (IT) are on the same bus bar. As with Relative Power Factor, everything between the two measurement points is now part of the ‘device under test’: the bushing and the instrument transformer.
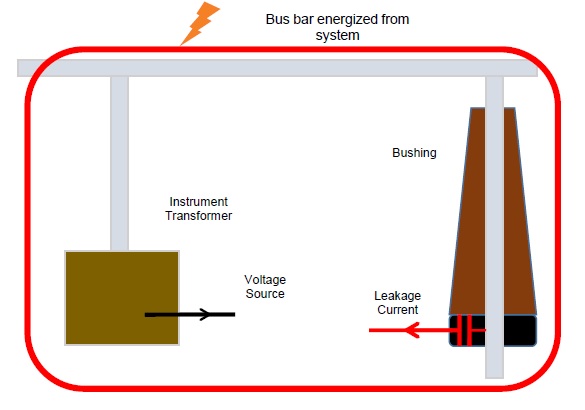
Figure 6. Set up for True Power Factor
If the IT and the bushing are on different sides of a transformer – say an HV bushing and an LV IT – then the whole transformer is also part of the ‘object under test’ and could be a cause of variation in the final power factor or capacitance values. As in the case of Relative Power Factor, the raw waveforms for both current and voltage are recorded and used to derive rms and phase values. To provide a valid voltage reference, the voltage and current measurements need to be either made simultaneously on a single monitor or referenced to GPS timing to allow for calculation of the loss angle and power factor.
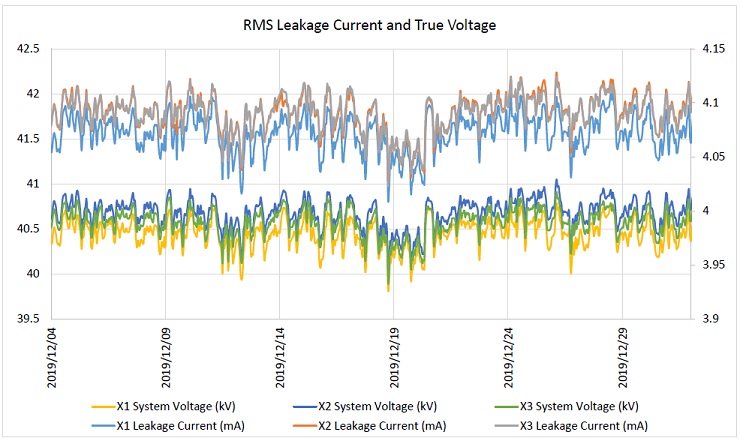
Figure 7. Simultaneous current and voltage measurements in a True Power Factor application
The individual current magnitude and phase for a set of three bushings and three ITs recorded over a four-week period are shown in Figure 7. Alerts may be set on voltage or current rms magnitude and/or phase. The relative phase between current and voltage yields the loss angle, which is used to determine the True Power. It is clear that there is variation in the resulting rms values over time – the results shown, however, are normal for this location. Alerts can be set on the instantaneous True Power Factor and Capacitance values, but it should also be possible to set alerts on the smoothed variation calculated on a 24-hour moving average of all available results, with the data shown in Figure 8. The daily variation is much smoother than the instantaneous values shown in Figure 7, but still reflects some of the system voltage variations.
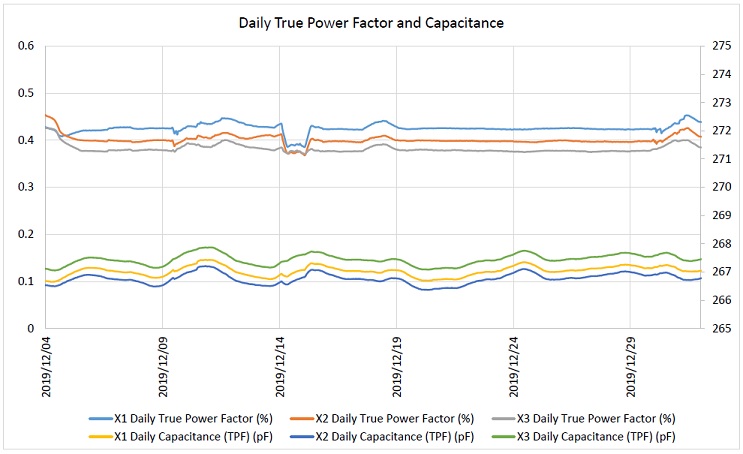
Figure 8. True Power and Capacitance daily variations
Unlike the relative power factor, there is no need to account for the system 120° contribution if the bushing and IT are on the same HV bar. We can also ‘calibrate’ the calculated power factor in software by setting an offset for the IT to give the final results as the expected power factor for the bushing, but remembering that any variation may not be caused by the bushing, but be a result of changes in the IT: we are, in fact, monitoring both assets. Again, harmonic content of the raw waveforms is calculated for monitoring and diagnostic purposes.
One significant advantage of True Power Factor is its use in simultaneous combination with Relative Power Factor. The result of the simultaneous measurements is to have two independent analyses for each asset – giving more confidence in a decision to energize and perform an offline test.
One significant advantage of True Power Factor is its use in simultaneous combination with Relative Power Factor: as shown using the outlines in Figure 9 where the measurements provide a view of condition of all assets involved, and build on the strength of each measurement:
-
The orange outlines identify individual bushing/IT combination monitored using True Power Factor and identify a problem on a particular phase.
-
The green outline covers the use of Relative Power Factor to monitor the performance of each bushing
-
The blue outline covers the use of Relative Power Factor to monitor the performance of each IT
The result of the simultaneous True and Relative Power Factor measurements is to have two independent analyses for each asset – giving more confidence in a decision to de-energize and perform an offline test.

Figure 9. Simultaneous True Power Factor and Relative Power Factor measurements
Discussion
A monitor should provide individual bushing power factors and capacitances, at an interval suitable for the failure modes of the specific bushing monitored. Recordings of the raw sinusoid waveforms should be available, and correlation techniques used to derive the fundamental system frequency and the harmonic content of currents/voltages. Alerts should be set based on knowledge of the bushing failure modes likely to be in operation and the specific application, and include alerts for temperature corrected:
-
instantaneous current and voltage values
-
relative and true phase angles and loss angles
-
relative and true power factor and capacitance
-
harmonic content
-
any data value of interest to the user
Bushing condition monitoring has been developed over several years to the point where monitoring systems may replicate offline tests. The increase in available data supports asset risk management, effectively providing usable information in a timely manner. Of course, there is a need to embed the monitoring system and the management of alerts into the organizational structure and culture, or the benefits of condition monitoring may not be realized.
Acknowledgements
The author would like to thank his many colleagues for the many discussions of the theory, practices and benefits of bushing monitoring over many years.
References
-
S. Rhoads, J. White & T. McGrail, “Developing and Using Justifiable Asset Health Indices for Tactical and Strategic Risk Management”, CIGRE, Paris, France 2018
-
C57.19.01, IEEE Standard for Performance Characteristics and Dimensions for Power Transformer and Reactor Bushings, 2017
-
Wyper et al, TransGrid, “Condition Monitoring in the Real World,” 79th International Conference of Doble Clients, Boston, USA, 2012
-
Hernandez, Lachman, Quintana, “Enhancing High-Voltage Bushing Diagnostics Through Power Factor/Capacitance Statistical Analysis,” 86th International Conference of Doble Clients, Boston, USA, 2019
-
M. Rowbottom, J. Beardsall, Drax Power et al, “Experience Integrating Data from Transformer Diagnostic,” 84th International Conference of Doble Clients, Boston, USA, 2017
-
“Three Bushing Cases”, dobleARMS User Group Meeting, 85th International Conference of Doble Clients, Boston, USA, 2018