

JUST THREE STEPS
Foreword from the Editor in Chief:
There is an old song by Lynard Skynard that employs the lyrics, “give me three steps mister, just give me three steps.” (That certainly dates me since I was sitting in the Fox Theatre in Atlanta, GA listing live decades ago to these very same lyrics.) But I digress. When we asked Diego Robalino and the folks at Megger to come up with an article about bushings, I was certain they would deliver. And deliver they have. This “Three Step” article is informative and illustrative of what I like best of Megger. They provide valuable “how to”, not just what or why. Well done Megger team.
Introduction
In the early 1900s, it was demonstrated that a capacitance-graded design helps achieve a better radial voltage distribution, thus enabling relatively smaller bushings to be used in higher voltage applications. Today, condenser bushings are used everywhere in applications exceeding 25 kV. Based on the materials used in the insulation system, condenser bushings can be classified into – oil impregnated paper (OIP), resin impregnated paper (RIP), resin bonded paper (RBP) and resin impregnated synthetic (RIS) bushings. Among these technologies, OIP is perhaps the most widely used. OIP relies on the combination of mineral oil with kraft paper to make a composite dielectric with superior insulating characteristics.
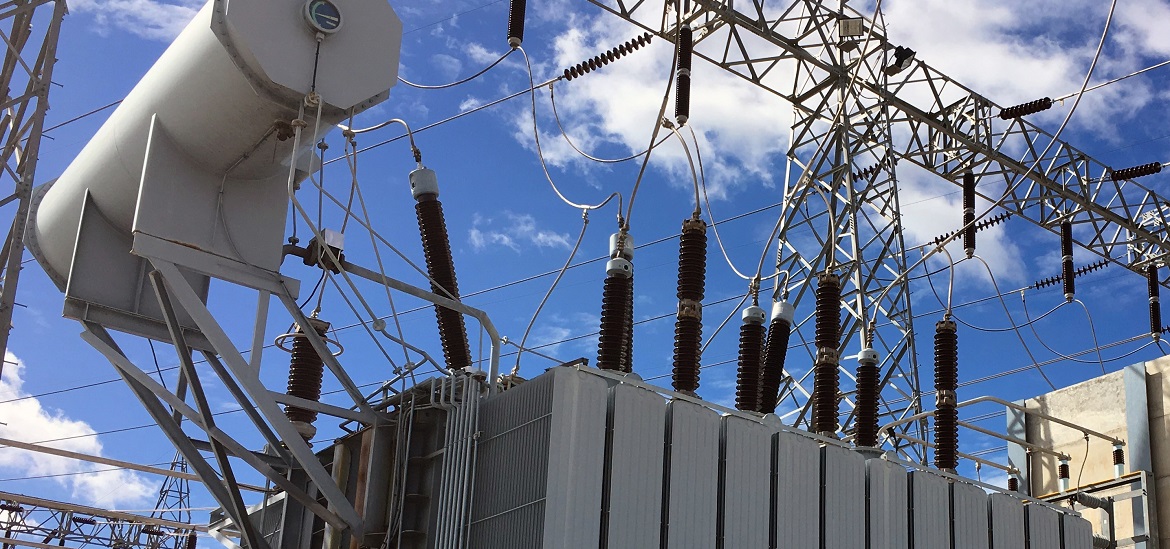
In the substation, bushings serve as the interface between the transformer and the rest of the system. They are designed to withstand high voltage stress during operation, to carry a high amount of current, and to operate under high temperatures. Being external, they are exposed to atmospheric conditions which can be harsh at times. Before installation, they can be easily damaged during transportation and once installed are a target for vandalism.
Because of these factors, bushing failure is, alongside tap-changers, one of the main causes of transformer failure. A transformer failure can be an expensive affair. Hence, bushing insulation health needs to be monitored effectively during its service life to ensure bad bushings are replaced in a timely manner. Several online and offline testing methods exist to monitor the condition of transformer bushings. Periodic testing of capacitance and power factor has been done on bushings for close to a century now. In recent times, the use of dielectric frequency response, an advanced application of power factor testing, has become an increasingly popular and effective method for bushing diagnostics.
Step 1: Line Frequency Power Factor Testing (LFPF) on OIP Bushings
The term power factor is used historically in the US, but the term dissipation factor or tand is used in other parts of the world. It is important to note that while power factor and dissipation factor are mathematically two different terms, they have numerically equivalent values when it comes to insulation. Hence, these terms can be used interchangeably for practical purposes with regards to insulation. These terms are related to each other through the formulae below:
Power factor = cos ϕ
Dissipation factor = tan δ
Delta = 90° – ϕ
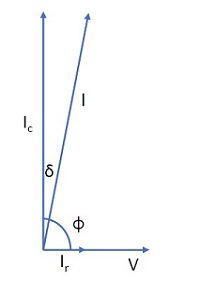 Figure 1. The relationship between φ and δ
While periodic testing of capacitance and power factor has been done on bushings for close to a century now, in recent times, the use of dielectric frequency response – an advanced application of power factor testing – has become an increasingly popular and effective method for bushing diagnostics.
Condenser bushing insulation system has two capacitance components – C1 and C2. In an OIP bushing, the capacitance grading is achieved by wrapping a conductive foil in oil-impregnated kraft paper multiple times around the conductor core. One of the outermost layers is connected to a test tap. The multiple layers of capacitors between the conductor core and the test tap can be represented by a single equivalent term C1. The test tap itself is isolated from the grounded flange and this insulation can be represented by the term C2. In service, the test tap is grounded. Capacitance and power factor measurement involves the measurement of dielectric losses in the C1 insulation that lies between the conductor core and the test tap at 10 kV. Power factor values obtained are numerically low numbers and hence are expressed in % instead of absolute values. Typical factory values lie in the range of 0.2 – 0.4% [1]. Factory testing yields reference values which are etched on the nameplates of bushings. Field test values are compared to these nameplate values. Any significant change in C1 power factor values points towards insulation deterioration of bushings.
Figure 2. Insulation system of condenser bushing
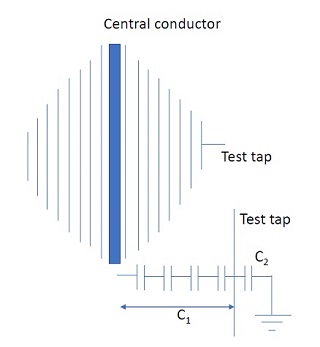 Additional measurements may be done on the C2 insulation that lies between the test tap and the grounded bushing flange. A fair C2 comparison may not be possible as different values could be obtained when the bushing is on a stand, and when it is mounted on a transformer. Besides, most of the time the C2 values are not even provided on the nameplate of the bushing. There are several other reasons why people tend to stay away from C2 analysis and focus on the C1 power factor values.
It is important to look for changes in C1 capacitance too. An increase in capacitance can be a result of shorted layers, whereas a decrease in capacitance most commonly results from a test tap connection problem.
There are several documents available that provide guidelines on interpretation and validation of power factor test results, both during factory acceptance testing (FAT) and field testing.
The following standards provide acceptance limits for C1 power factor:
IEEE C57.19.01 – IEEE Standard Performance Characteristics and Dimensions for Outdoor Apparatus Bushings [2]; and
IEC 60137 – Insulated bushings for alternating voltages above 1000 V [3]
The limits are specified in Table 1.
Table 1. Bushing C1 acceptance %pf limits specified in standards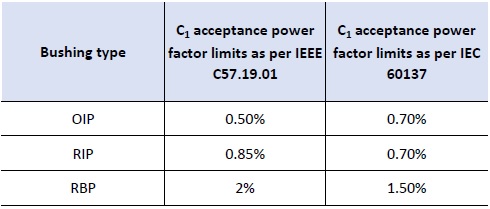
All of the limits specified in Table 1 are meant for power factors measured at 20°C or normalized to 20°C.
IEEE C57.152 – IEEE Guide for Diagnostic Field Testing of Fluid-Filled Power Transformers, Regulators, and Reactors [4] says:
-
A change from the initial reading by 1.5 to 2 times warrants more frequent testing of bushings;
-
A change from the initial reading by more than 3 times warrants removing the bushing from service;
-
A change in capacitance by more than 5% is a cause to investigate the suitability of bushing for continued service;
-
These guidelines are in line with the guidelines provided in IEEE C57.19.100 – IEEE Guide for Application of Power Apparatus Bushings [5].
As can be seen from these guidelines, validation involves either comparing power factor values against the set limits or observing the change in power factor over time. One point that is often overlooked while analyzing power factor results is the effect of temperature. Measuring at different temperatures can yield different values, so it is important to normalize the measured power factor values by correcting them to a reference temperature (20°C). There are correction factors available from manufacturers or other references, but those are generic and cannot be relied upon in all cases.
Measuring at different temperatures can yield different values, so it is important to normalize the measured power factor values by correcting them to a reference temperature (20°C). The correction factors that are available from manufacturers or other references are generic and cannot be relied upon in all cases.
Step 2: Narrowband Dielectric Frequency Response (NBDFR) on OIP Bushings
Standard 10 kV power factor test sets with expanded capabilities of frequencies from 1 Hz to 505 Hz can run power factor measurements at multiple frequencies. The curve obtained by plotting these power factor values, called Narrowband Dielectric Frequency Response (NBDFR), gives us additional information on the overall insulation condition of the bushing. This reduced frequency band does not provide the level of moisture in the insulation, but it does point to the presence of moisture and/or impurities in the insulation.
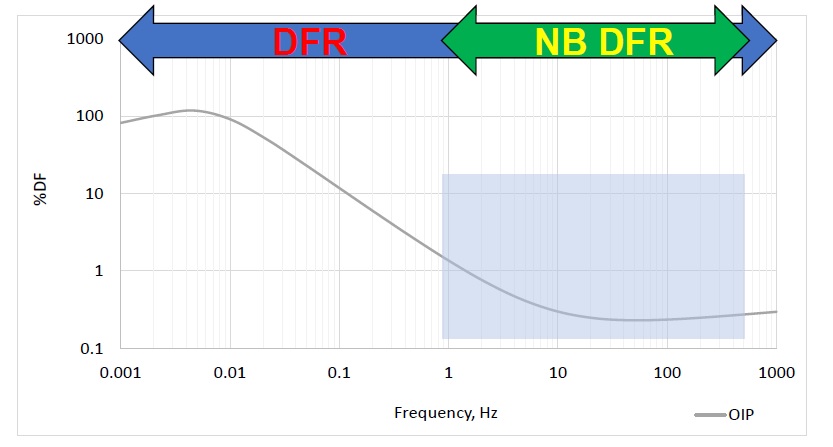 Figure 3. Dielectric frequency response
NBDFR is a continuum in the evolution of power factor testing. In about three minutes, valuable information is added to the routine power factor test. It provides early indication of changes in the dielectric response, potentially related to aging and insulation degradation. This measurement can reveal an emerging problem in the insulation at an early stage and represents a proactive way to prioritize maintenance activities and dedicate resources to more advanced testing practices.
NBDFR is typically performed at a low voltage of 250 V. As a low energy test, it is safer to perform so that it allows visualization of the unique dielectric signature of the object under test. Therefore, a graphical comparative analysis between sister bushings mounted on one common object is possible and it also provides the opportunity to set limits and analyze the dielectric behavior in other frequencies more sensitive than line-frequency (50/60 Hz) i.e. 1 Hz and 10 Hz.
Effect of Temperature
IEEE C57.12.90 section 10.10.4 Note 3 (b) states that “Experience has shown that the variation in dissipation factor with temperature is substantial and erratic so that no single correction curve will fit all cases.” [6]
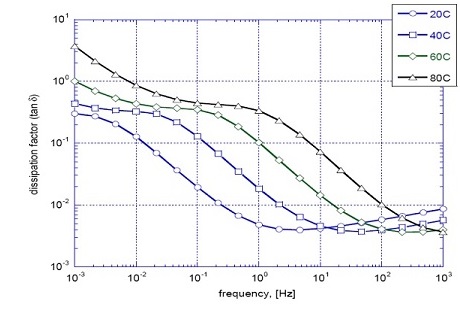
Power factor is temperature dependent. It has been found that the frequency response and thermal response of a dielectric are related. The dielectric frequency response of an OIP system shifts horizontally with change in temperature, without any change in the shape of the curve itself.
Figure 4. DFR curves obtained at different temperatures
Using Arrhenius equation, it is possible to determine the exact horizontal shift that would occur in a curve for a certain change in temperature: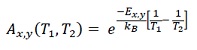 This enables us to determine the power factor that would be obtained at 20°C, while running a DFR measurement at any other temperature. Figure 5 shows dielectric frequency response curve obtained with the temperature correction applied, alongside the measured curve. Figure 6 shows the temperature dependence curve obtained for the same bushing utilizing the data obtained from DFR.
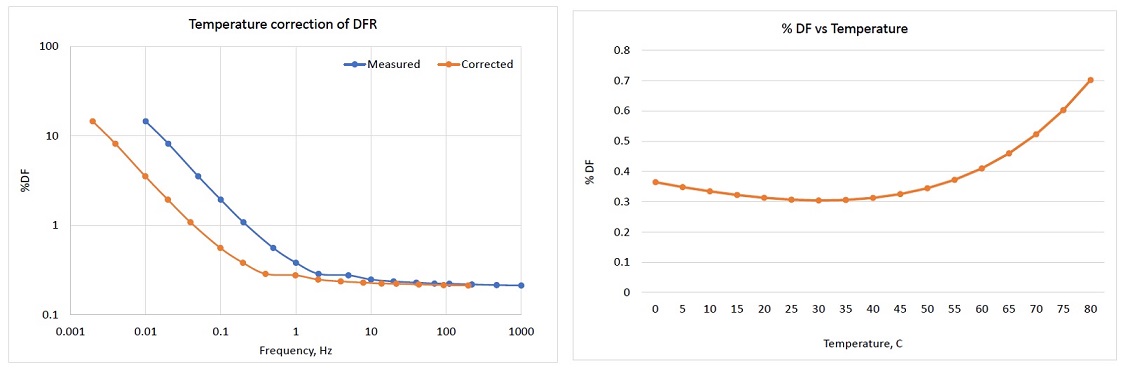
Figure 5 (left). Measured and temperature corrected DFR curves.
Figure 6 (right). Temperature dependence of bushing dissipation factor determined from DFR measurement
Getting temperature corrected DFR curves enables us to assess the correct values at 1 Hz, 10 Hz and 60 Hz without having to worry about the effect of temperature on the assessment. There is no need to wait until the temperature is close to 20°C to test the bushings, or to rely on generic correction factors which may or may not be apt depending on the insulation condition of the bushings.
This method is known as Individual Temperature Correction (ITC). More information about ITC is provided in [7] and [8].
Step 3: Dielectric Frequency Response Measurements on Bushings
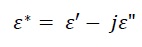
The insulation system of an OIP bushing is made up of multiple layers of capacitors formed by conductive foil wrapped in oil impregnated kraft paper. The oil and paper form a composite dielectric system, and the dielectric frequency response obtained from the bushing is a combination of the individual responses from the oil and paper insulation. The permittivity of the insulation can be expressed as a complex term:
-
The relative permittivity of a dielectric is a complex term and can be represented as
-
The dissipation factor is related to the permittivity by the following equation:
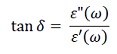
The dissipation factor varies with frequency as both dielectric constants are frequency dependent. The behavior of these constants differs for oil and paper. Figures 7 and 8 illustrate how the typical response obtained from a bushing is an amalgamation of the individual responses from oil and paper.
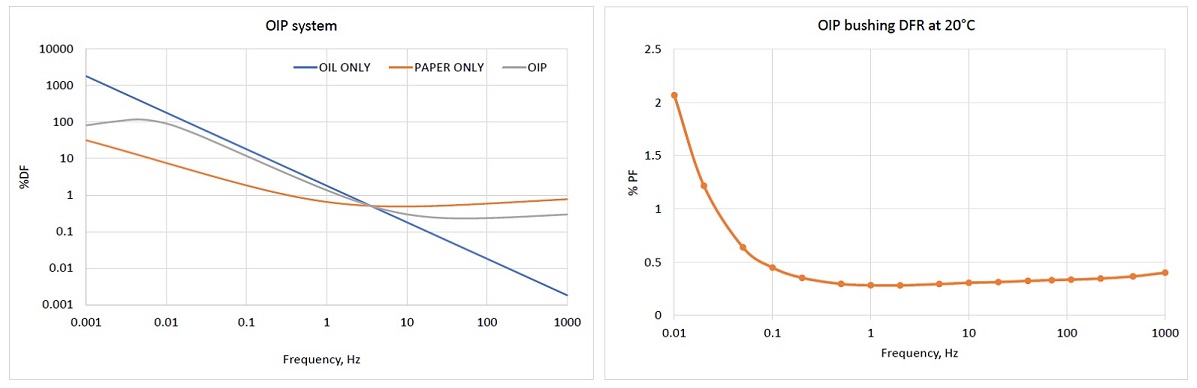
Figure 7 (left). DFR responses from individual dielectrics and composite dielectric
Figure 8 (right). Dielectric Frequency Response of an OIP bushing
In cases where it is not possible to get definitive answers through narrowband dielectric frequency testing, a more in-depth analysis can be carried out by measuring the dissipation factor over a wider range of frequencies. Analysis of DFR curves can yield important information such as moisture content in the paper, conductivity of the oil. The presence of contamination or other physical issues can result in atypical responses with the most prominent deviations seen in the lower frequencies.
In cases where it is not possible to get definitive answers through narrowband dielectric frequency testing, a more in-depth analysis can be carried out by measuring the dissipation factor over a wider range of frequencies. Analysis of DFR curves can provide important information on the moisture content in the paper and conductivity of the oil.
Effect of Noise
DFR measurements are typically carried out at a low voltage of 140 V. Because of the test involving a wide range of frequencies and low currents, the presence of noise can adversely affect the accuracy of the measurements. This can happen in highly noisy environments even though the instrument may have a high signal-noise ratio. The influence of noise can easily be observed in the obtained DFR curves.
Noise disturbances can be overcome by testing at a higher voltage. The use of a voltage amplifier in conjunction with the DFR measurement device can significantly improve the signal-noise ratio, resulting in accurate and reliable DFR measurements.
Figure 9 shows the measurement curve on the B phase bushing obtained through a DFR test that was carried out on the line bushings of a 50 MVAr reactor using an IDAX. As can be seen, there is a fluctuation in the measured power factor values due to the presence of noise. The effect of noise is more commonly observed while testing objects with low capacitance like bushings, instrument transformers, etc. because in these cases the magnitude of the measured current is lower, and hence more susceptible to noise. The magnitude of the capacitive component of the current is given by the following equation:
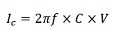
The DFR test was repeated on the same bushing at a voltage of 1.4 kV rms by using a voltage amplifier VAX. The results are shown in Figure 10.
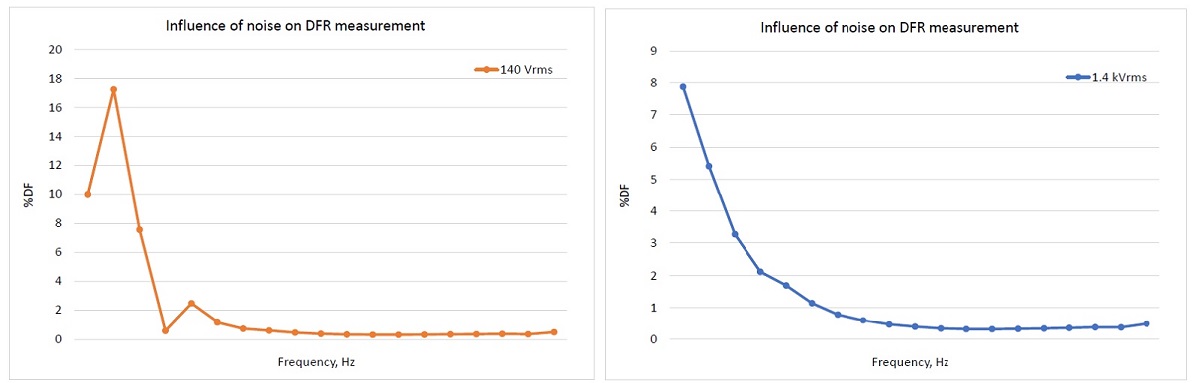
Figure 9 (left). DFR measurement under the influence of noise, at 140 V rms
Figure 10 (right). The noise was overcome by conducting a DFR test at a higher voltage of 1.4 kV rms
Field Experience
Step 1: PF Analysis
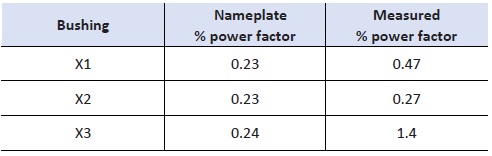
Out of three OIP HV bushings, an increase in the power factor was observed on two bushings: X1 and X3, at line frequency as illustrated in Table 2.
Table 2. Nameplate and measured pf values for three bushings
-
According to IEEE C57.152, the line frequency power factor values for X1 and X3 at 20°C exceed acceptable limits.
-
According to CIGRE TB 445, the power factors of the bushing X1 and X2 come within limits, while only bushing X3 comes outside acceptable limits.
-
Based only on the line frequency power factor values, we may say that the bushings X1 and X3 are not in good condition, and the bushing X2 should be investigated further.
-
Hence, we move onto step 2 and run a narrowband DFR test to evaluate power factor at other frequencies (20°C corrected).
Step 2: Narrowband DFR Analysis
NBDFR test was carried out on three bushings from 1 Hz to 500 Hz. Figure 11 shows an increase in %power factor for the bushings X1 and X3 at lower frequencies.
The obtained thermal response curves were different for each bushing because of the variations in dielectric frequency responses. These are shown in Figure 12.
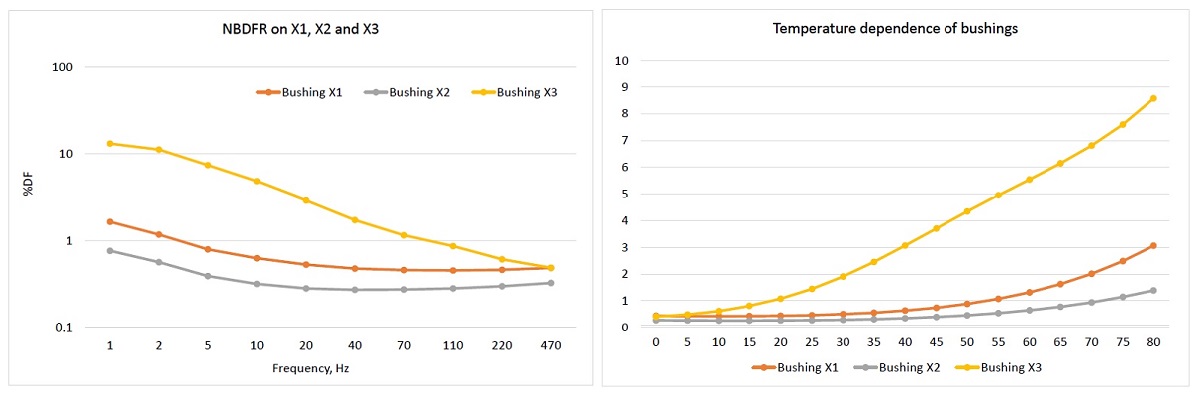
Figure 11 (left). NB DFR measurements on all three bushings
Figure 12 (right). Temperature dependence curves for all three bushings
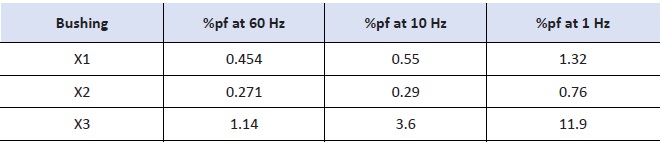
The temperature corrected power factor values obtained at different frequencies are shown in Table 3.
Table 3. Temperature corrected %pf values obtained for three bushings at different frequencies
For a “good” component, the temperature dependence is weak. When the component gets older and/or deteriorates, the temperature correction factor becomes much higher, which means that the temperature dependence is directly related to the dielectric response of the bushing. In the above example, the bushing X3 shows a huge temperature dependency as compared to bushings X1 & X2. An increased dissipation factor at higher temperatures is a good indicator of bushing problems.
As per the studies carried out by Megger based on over 20 years of expertise in DFR, the limits shown in Table 4 have been proposed for analysis of %pf measured at the frequency of 1 Hz.
Table 4. Proposed limits for %pf at 20°C and 1 Hz
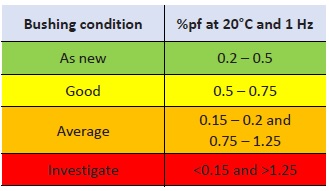
A high power factor measured on bushings X1 and X3 at 1 Hz indicates insulation-related problems. But we do not know if the cause lies in the solid insulation or the liquid insulation. In order to establish this, a further analysis can be carried out by doing a full dielectric frequency response measurement.
Step 3: DFR Analysis
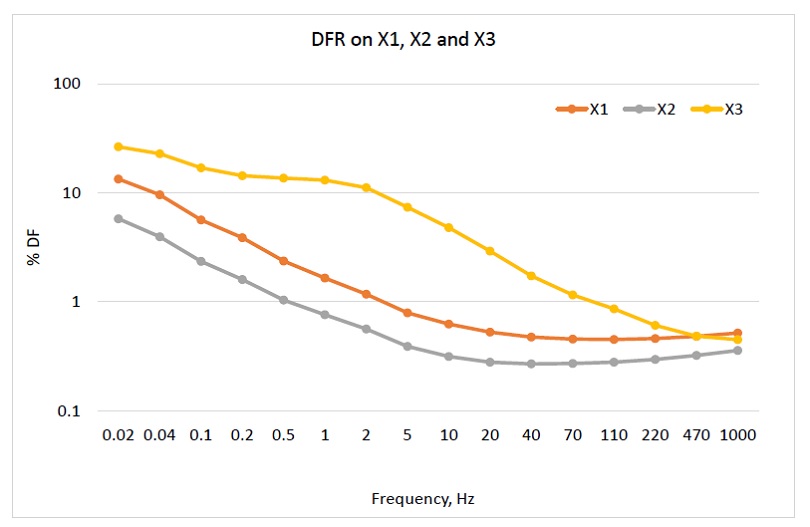
Figure 13. DFR measurements on all three bushings X1, X2, X3
The results that were obtained from the full DFR analysis are shown in Table 5. The limits for %mc and conductivity of the oil proposed by Megger are shown in Table 6.
Table 5 (top). %mc estimation and conductivity of the oil obtained from full DFR analysis
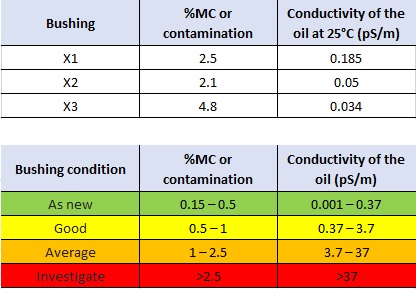
Table 6 (bottom). Proposed limits for %mc and conductivity of the oil by Megger
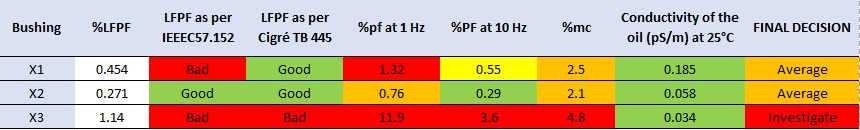
Overall diagnostics
Table 7 summarizes the final assessment that is obtained from the combination of all discussed measurements.
Table 7. Final assessment based on all measurements
Conclusion
The line frequency power factor testing, which has traditionally been used for the bushing condition assessment, has its limitations. These limitations can be overcome by conducting dielectric frequency response tests. Owing to the increased sensitivity of power factor to moisture and contamination at lower frequencies, DFR enables us to detect bushing insulation problems at an earlier stage. Any indecisiveness over the course of action to be taken after the conducted narrowband dielectric frequency response test can be eliminated by conducting a full dielectric frequency response test, which enables us to estimate the presence of moisture in the solid insulation and conductivity of the oil. DFR also solves the problem of temperature dependence of the power factor, enabling us to get values for the power factor corrected at 20°C. Testing in a noisy environment can lead to disturbances in the DFR measurement caused by the frequency range and the low currents involved. In this case, testing at higher voltages (1.4 kV rms) enables us to get better DFR results.
References
[1] W. A2.34, "Guide for transformer maintenance," Cigre, 2011
[2] IEEE C57.19.01-2017 - IEEE Standard for Performance Characteristics and Dimensions for Power Transformer and Reactor Bushings
[3] IEC 60137:2017 - Insulated bushings for alternating voltages above 1 000 V
[4] IEEE C57.152-2013 - IEEE Guide for Diagnostic Field Testing of Fluid-Filled Power Transformers, Regulators, and Reactors
[5] IEEE C57.19.100-2012 - IEEE Guide for Application of Power Apparatus Bushings
[6] IEEE C57.12.90-2015 - IEEE Standard Test Code for Liquid-Immersed Distribution, Power, and Regulating Transformers
[7] Dr. P. Werelius, Dr. D. Robalino, J. Cheng and M. Ohlen, "Dielectric Frequency Response Measurements and Dissipation Factor Temperature Dependence," 2012
[8] Dr. D. Robalino, "Accurate Temperature Correction of Dissipation Factor Data for Oil-Impregnated Paper Insulation Bushings: Field Experience," 2011

Sanket Bolar
Sanket Bolar, MSc is a Substation Applications engineer at Megger. From the beginning of his professional career, Sanket was directly involved with testing and condition assessment of power transformers working for Siemens Ltd (India). While working on his Master’s Degree, Sanket became part of Megger as part of the internship educational program. In 2015 upon graduation, he joined Megger as Applications Engineer covering a broad spectrum of substation products from transformer to power quality applications. Sanket graduated from Mumbai University, India in 2009 with a Bachelor’s in Electrical Engineering and received his Master’s in Electrical Engineering specializing in Power Systems from North Carolina State University in 2015. He is a member of IEEE.