


BUSHING FAILURES: A DIFFERENT APPROACH
Foreword from the Editor in Chief
Even a failing bushing which will not lead to a catastrophic failure can harm people due to burst porcelain insulators and broken fragments that can be catapulted through the air by the force of the breakdown arc. This article is the continuation of the first article in this series and continues to discuss the early detection of incipient bushing failures by using the knowledge of different failure mechanisms discussed previously.
This article is the continuation of the first article in this series and continues to discuss the early detection of incipient bushing failures by using the knowledge of different failure mechanisms discussed previously.
Introduction
The condition of bushings can be accessed by different measurement techniques and online and offline approaches. Polarization-Depolarization Current (PDC) and the Frequency Domain Spectroscopy (FDS) measurements are offline measurements beside the common offline Power Factor measurements and can provide a good insight in respect to moisture ingress. Moisture ingress can easily get missed in “standard” offline tests, which will be explained later in this article.
Removing bushings from the transformer during a planned outage to test them in a high voltage lab will allow conducting measurements at higher temperatures, which helps early detection of moisture.
Since offline methods demand de-energization of the transformer and mobilizing the workforce and equipment depending on the measurement to be taken, this can only be done periodically (yearly/bi-yearly, etc.), and critical faults developing between two consecutive measurement cycles can be missed. Online bushing monitoring can mitigate that risk.
Incipient Fault Detection
Detection Parameters
Power Factor / Dissipation Factor
The power factor, i.e. the dissipation factor reflects the condition of the insulation system and is the ratio of the resistive and capacitive part of the leakage current (see Figure 1). The formulas of the power factor and the dissipation factor can be seen in Figure 1. In the discussion below I only use the term power factor. Everything said about the power factor is valid for the dissipation factor as well.
In relation to temperature and frequency, the power factor is a non-linear parameter which can be used independently of temperature and frequency to assess bushing condition. The main influential parameter on the measurement is the moisture in the insulation. Various measurement methods will be discussed in this article.
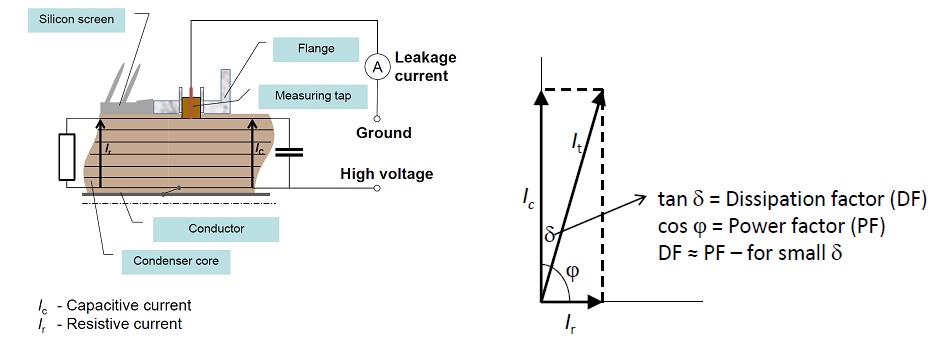
Figure 1. Power factor / Dissipation factor
Figure 1 shows the power factor over temperature at constant frequency for bushings with a different moisture content. Three important facts can be concluded from that graph. First, the higher the temperature, the clearer is the difference between a healthy, low moisture content bushing and a bushing with moisture ingress in an early stage. Second, at temperatures below 40°C incipient moisture ingress causes only a slight increase of the power factor compared to a “dry” bushing, which can be easily missed. Third, the temperature compensation for “wet” bushings is not valid anymore (Figure 2).
Power factor measurements over frequency, over a range of 10 Hz to 300 Hz, can bring little or no additional information for assessing bushing condition. Measuring Polarization-Depolarization Current (PDC) and Frequency Response Analyzes (FRA) for frequencies starting from 1 MHz is much more sensitive, especially for incipient moisture ingress. FDS (Frequency Domain Spectroscopy) and PDC measurements are usually combined to shorten the measurement time.
Figure 3 shows the results for the measurements of two different bushings using the FDS/PDC method. The 50 Hz power factor values at ambient temperature did not show a significant difference, but the FDS/PDC measurement did, and the 50 Hz measurement at higher temperature would show the difference as well.
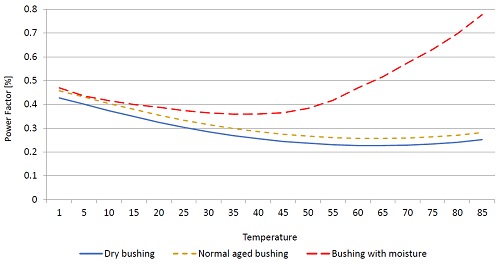
Figure 2. Power factor / Temperature curve
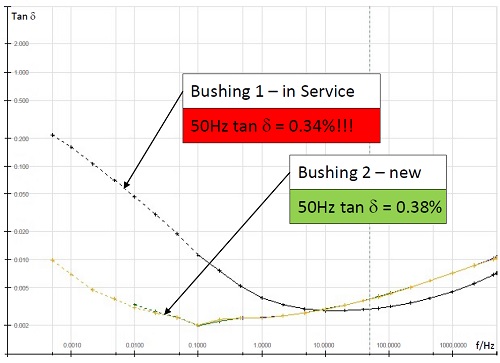 Figure 3. FDS/PDC measurement of dry and wet bushings [1]
An incipient fault at an early stage can be missed by only assessing the power factor measured around network frequency and at ambient temperature. Finally, bushing 1 was taken out of service as moisture ingress was clearly detected.
Capacitance
Almost 100% of the leakage current is capacitive current and based on the capacitive layer design (Figure 4). If two aluminum layers are short circuit (partial breakdown), the total capacitance value will increase which will result in an increase in the leakage current as well.
If the number of layers is known, the percentage of capacitance increase can be converted into the number of layers involved in that partial breakdown.
If, for example, a 550 kV bushing has around 60 to 70 capacitive layers, a partial breakdown between two layers will increase the capacitance by about 1.5% (which is equal to the increase of dielectric stress). A 138 kV bushing with maybe 20 to 30 layers would see a 4% increase in capacitance. Therefore, the percentage increase of capacitance is the primary factor for the risk assessment.
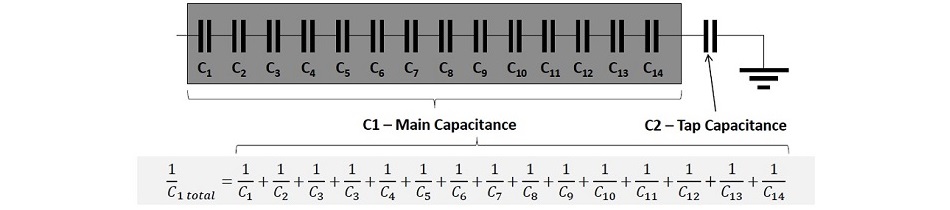
Figure 4. Bushing series capacitances
Partial Discharge
Often the bushing tap is used to measure PD. The main bushing capacitance C1 is acting as coupling capacitor and the PD measurement is based on IEC 60270 method. This principle is used during factory testing, re-testing in the factory, offline testing and online monitoring of bushings and transformers.
During factory or offline tests, external disturbances can be avoided by proper screening. On site it remains difficult to identify the origin of the PD activity without further investigations.
Figure 5 shows the challenges for online PD monitoring conducted through bushing taps. The readings can easily be influenced by external disturbances or external PD. External corona discharges with several Nano Coulombs (nC) of magnitude can easily mask discharges originated from transformers or bushings.
Online PD monitoring through bushing taps usually cannot provide high confidence in the assessment results. A UHF sensor in the transformer close to the bushings can deliver better results when assessing the condition of transformers and bushings. Power factor and capacitance provide data that is reliable enough to make bushing health assessments.
Condition Assessment Approaches
Condition assessment techniques can be based on offline tests, online tests, and lab re-tests. Offline bushing tests are tests where an external voltage source is used while the transformer is offline. Lab re-tests are tests where the bushing will be removed from the transformer during an outage (planned or unplanned) and tested separately in a high voltage lab. Online tests or monitoring will be done while the bushings are in service.
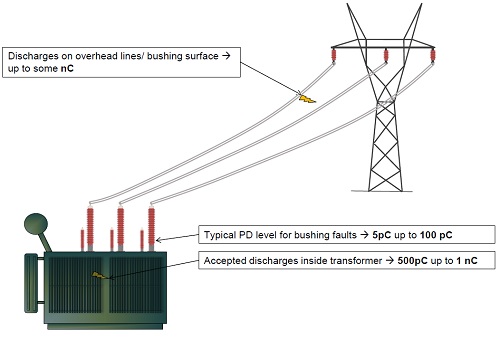 Figure 5. Challenges of online PD measurement through bushing taps
Offline Testing
The frequency of offline testing of bushings depends mainly on the maintenance strategy. Usually new bushings will be tested for the first time after about 5 years (sometimes earlier, sometimes later, or never). As a good practice, further test cycles should be scheduled based on the bushing condition. For example, if there is an increase in the power factor or the capacitance detected, the measurement cycle should be shortened. Depending on the expected degree of degradation, it might be decided to have the next test after a year, half a year or even earlier. If the concept of periodic offline measurements is being followed, it is a good practice to have spare bushings available to be able to replace bushings in due time if needed. If no spare bushings are available, depending on the circumstances, network operators might be forced to put the transformer back into service with the critical bushing and the risk of a breakdown.
The advantage of offline measurements is that different tests can be carried out. The most common one is measuring the power factor and the capacitance with usually a 10 kV voltage source and a frequency different to the network frequency to avoid any influences of magnetic fields present in the substation environment. It is also common to conduct power factor measurements at different frequencies between 10 Hz to 400 Hz.
FDS/PDC measurement as discussed above have a higher sensitivity to early moisture ingress. Here the supply voltage is usually only 200 V to 2 kV compared to conventional power factor measuring devices with 10 kV supply. The FDS/PDC measurement delivers low leakage currents, which makes it susceptible for disturbances. Further, the duration of such measurement per phase, assuming a combined FDS and PDC (below 0.1 Hz), is somewhere between 30 minutes and 1 hour 45 minutes, depending on the lowest frequency selected [2].
PD tests, which are mainly focused on transformers themselves, are sometimes carried out as well. For these tests, a transformer test trailer and extensive screening is necessary to carry out a conclusive PD measurement in the field, which translates to high costs and efforts.
A simple method to test the insulation of an OIP bushing is to take an oil sample and do the dissolved gas analyzes in the lab. As the oil volume of an OIP bushing is comparably small, special attention need to be paid not to go below the minimum oil level.
Offline tests are conducted at a certain point in time. A trending can be done in relation to previous measurements. Nevertheless, an accelerated fault development in-between two consecutive measurements will remain undetected and can lead to an unexpected catastrophic failure. Technical expertise for the execution of online tests must be built up within the organization or needs to be brought in for any single test.
HV Lab Re-testing
Lab re-tests of bushings from the field are an exception, but in fact a very powerful way for assessing their condition. The bushing must be removed from the transformer and brought to an HV test lab for testing before it is installed back to the transformer.
As part of a lab re-test, beside the power factor and capacitance measurements, a meaningful PD measurement concerning the bushing can be carried out. At a slightly increased power factor compared to factory values, specifically for RIP and OIP bushings, the bushing can be heated in an oven and tested again for a more accurate assessment (Figure 5). All other measurements can be applied in the same way as described in the chapter above.
Nevertheless, any degradation that might occur between two consecutive measurements can remain undetected, and catastrophic failures can occur. Further, the efforts and costs are higher for the removal and re-installation of the bushing. Additionally, an HV lab which has the capability to conduct such tests, must be within a suitable distance to the site considering limited outage durations.
Online Tests and Monitoring
Due to the limited accessibility of bushings in service, there are only a few different periodic online tests and measurements which can be done. These are infrared scans for high temperature areas which indicate overheating due to overload, bad contacts, low oil levels in bushings, etc. Further, surface discharges or excessive corona can be detected through ultraviolet cameras or through acoustic measurements or imaging (more advanced methods use microphone arrays). These methods can also be applied online, but they can only cover a limited area of a substation. A solution which could cover a complete substation can be costly.
The most typical online applications are monitoring of the power factor and capacitance. Also, especially in South America (Brazil in particular), monitoring of the oil pressure inside OIP bushings is quite typical. In very few cases dissolved H2 (hydrogen) in the insulation oil of OIP bushings is monitored.
The advantage of online tests and monitoring is that the bushing will be accessed under its operating conditions. As discussed above, different operating conditions can have a different influence on the health of a bushing. A combination of various stresses can occur. Therefore, online testing will provide the most accurate and in-time assessment of bushings in service. Additionally, the usage of online monitoring will allow a continuous recording and trending of the monitored data. Trending information is crucial for the detection of degradations in bushings. The speed of the development of the fault will give the reaction time for the rectification efforts. Online monitoring allows the operators to pull in internal or external expertise only if needed as the measurement results are already available.
Additionally, under high load conditions the bushing will also be heated. This allows measurement of the power factor at higher temperatures, which eases the detection of moisture in the same way as explained for offline lab re-tests.
The challenge is to strengthen the online monitoring equipment against disturbances. Also, especially for online monitoring systems, the equipment needs to be installed and commissioned by experts. Usually, a data network must be available to transfer the data to a remote assessment center or another point where the data will be collected and assessed by operators, maintenance crews, asset managers, etc.
Online Monitoring Approaches
There are three different online bushing monitoring approaches and their combinations that are used today. PD monitoring through the bushing tap will not be further discussed considering it is mainly applied to detect the PD in the transformer itself. Likewise, capacitance monitoring, which is the simplest online bushing monitoring method, will not be discussed because it is seldomly used as standalone technique due to its limited ability to detect most of the incipient faults.
Balanced Current Method
The balanced current method, also known as the sum of currents method (Figure 6) is a frequently used method for bushing monitoring today. The assumption is that, under perfect circumstances, the sum of the leakage currents of the three bushings of different phases installed on the same transformer, under consideration of their phase angles, is zero. The perfect circumstances mean that for all phases the magnitudes of the voltage amplitudes are absolutely the same, and the phase shifts between the phases are exactly 120 degrees. Further, the bushings are considered to behave in the same way as their sister bushings on the same transformer.
In reality, electrical networks carry unbalanced load. Phase asymmetries regarding voltage magnitude of 1 to 1.5% and 0.2 degree in phase angle variations are very common for networks that are considered stable. Much higher asymmetries can be seen in more unstable networks.
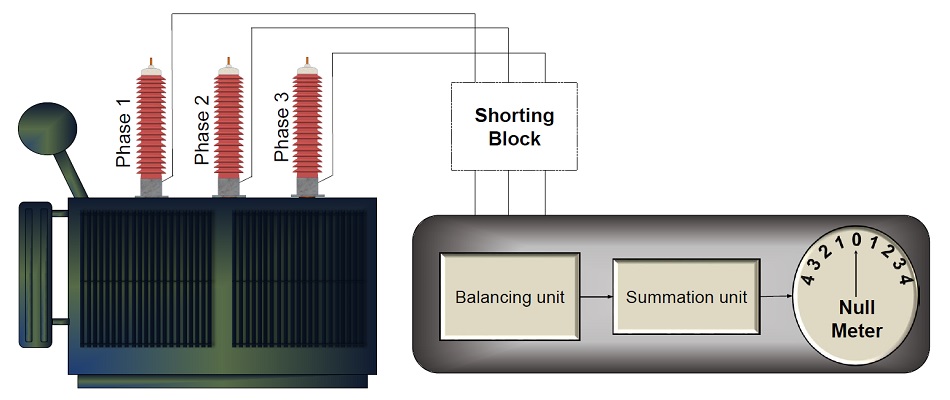 Figure 6. Principle overview of the balanced current method
The asymmetries change with load in a daily, seasonal and unpredictable manner. Changes in capacitance of a bushing (partial breakdowns) can still be detected accurately as the general fluctuations of the voltage magnitude across all three phases are lower compared to a critical partial breakdown.
A bigger challenge is the asymmetry in the phase angle. If the load asymmetry causes 0.2-degree phase difference, this will result in a deviation in the power factor measurement of about 0.35% (tangents of the 0.2 degree), which can cause a failure of more than 100%, assuming the power factor of a healthy OIP bushing is around 0.25%! Small power factor changes, caused by moisture ingress, cannot be detected with certainty or they can only be detected in a late stage of degradation.
Resent systems use self-learning methods which record the typical daily and seasonal behavior of the bushings to predict the load conditions. Nevertheless, the achievable accuracy in terms of the power factor reading is limited. Further, the power factor is mostly displayed as a relative change compared to sister bushings. Using this method for single phase transformer is even more challenging and for a single bushing impossible.
Reference Method
Today, the balanced-current-based measuring systems also come combined with a reference method. Here the bushings of the outer phases are being compared with the middle phase bushing. As the bushings are still being compared to each other, the load asymmetry will cause the same variations in power factor as will the balanced current method described above.
The accuracy of the power factor and capacitance measurements can be increased by using a reference from the same phase. In the absence of a gas filled standard capacitor as used for offline measurement, existing voltage transformers from the same phase as the bushings can be used as reference. The output of voltage transformers (VT) is not load dependent. The principle of this method is to measure the phase shift between the bushing leakage current and the reference signal from a VT. The usage of existing equipment reduces the need of additional hardware. Figure 7 illustrates the principle of the reference method.
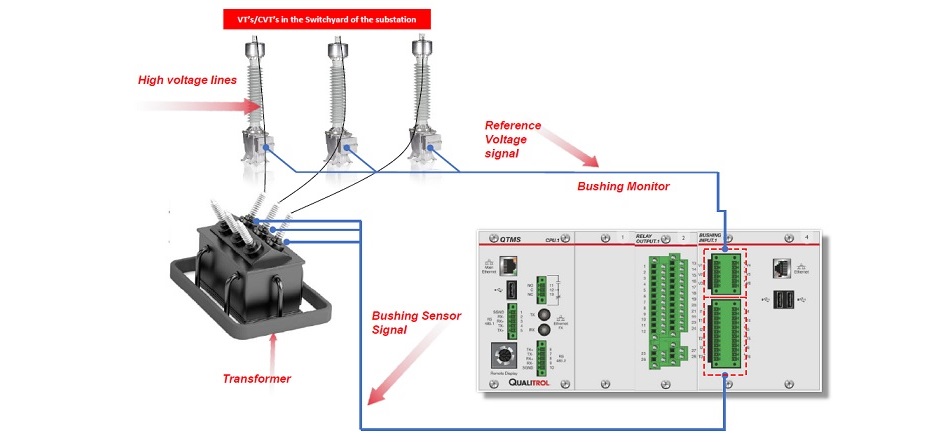 Figure 7. Principle of the reference signal method
After the synchronized digitalization of both input signals, all signal processing will be done by software algorithms. Existing constant phase shifts caused by cabling and VTs must be compensated.
The major challenges are elimination or limitation of noise, and availability of the stable reference source.
In the absence of a VT or CVT as a reference, another bushing from the same phase, but from a sister transformer, can be used. Figure 8 shows a noisy signal before and after signal processing, while Figure 9 illustrates another example of recorded raw data. Due to the relatively high amplitude, the signal from the reference source (blue curve) is almost not disturbed, while the signal coming from the bushing tap has a noise component of about 15 to 20%.
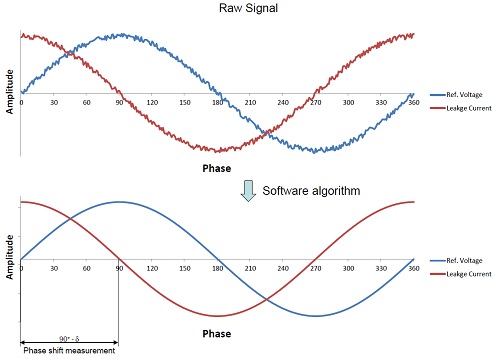 Figure 8. Example of effective noise elimination
Conclusion
Incipient faults must be detected early enough to avoid costly outages, injuries and environmental impacts. Offline tests provide a variety of methods for the assessment of bushings, but they might fall short in predicting critical conditions in service. Online monitoring can close that gap and is gaining more importance nowadays. Different bushing monitoring methods provide different accuracies. Common methods, for example those based on balanced current principles, have limitations due to the influence of the natural imbalance in the electrical networks.
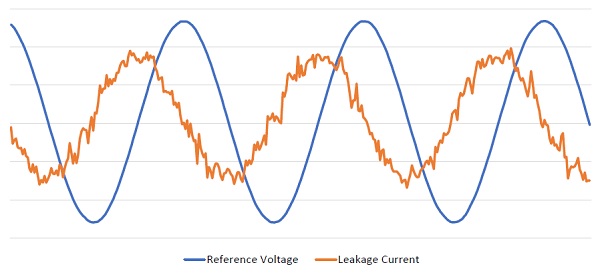 Figure 9. Raw data sample from site
By using a reference from the same phase, we can achieve higher accuracy and a better detection of incipient faults. Using independent reference sources for each bushing will also allow to have bushing monitoring systems for a single bushing only. Finally. the power factor result is a direct measurement and does not need a conversion from a relative value as for the balanced current method.
References
1. Kopp, Gunther, et al., “Frequenzabhängige tan δ Messung zur Analyse des Zustandes von Hochspannungsdurchführungen,” Transformer Life Management Conference, Hannover, Germany, 2010
2. OMICRON, DIRANA Brochure Omicron, OMICRON L2894, November 2018
3. Kopp, Gunther, Master Thesis, Schweinfurt (Germany) and Zurich (Switzerland), 2009