

CASE STUDY
What is a transformer save? This is not a trick question. To most readers, the answer is simple. A bona-fide transformer "save" is when action is taken to protect a transformer, the action being motivated by available information that is predicting a failure.
Since the earliest useful microprocessor was available, there have been many types of condition monitors aimed at the utility substation. Most have come and gone and were less reliable than the equipment they were monitoring. Many of these had some merit but in the early days, the communication of the data to people who cared was not possible.
When the SCADA, cell modems, and networks became available, then the problem of data management became an issue. Scanning through data produced by monitors by asset SMEs quickly became very difficult, if not impossible.
Because the lifespan of the early monitors, and many companies who produced them, was relatively short, the concepts never reached their full potential of usefulness. The end goal for most was to give an actionable signal that an asset was in trouble, with a time margin to intervene and prevent a failure. Continually serving up data for a "panel of experts" to then give a recommendation on the condition of an asset was not the value proposition.
There were utility managers who understood the potential benefits of online monitoring yet did not share their operations insight and strategies with maintenance supervisors. This caused the personnel in maintenance to shun the concept of online monitoring. Many field people believed that the monitors would replace them, and their jobs were at risk. Even thirty years ago, online continuous monitoring of substation assets had proven to be an excellent tool in the overall scheme of equipment maintenance, but was not readily accepted.
A bona-fide transformer "save" is when action is taken to protect a transformer, motivated by available information that is predicting a failure.
The early adopters of monitoring quickly learned that monitoring systems do not immediately reduce the maintenance budget, but that the reverse was true. Monitoring quickly showed the "bad actors", requiring them to be moved up on the list for service. Only after the emergent assets were repaired and tested would the O & M expenses gradually decrease. Maintenance managers discovered a "sweet spot" where deployed monitoring and regular manual testing worked together to produce an overall minimum.
With the refinement of the monitoring system over decades, the total operating costs have decreased by monitoring justifying itself and with the forced reduction in manual offline testing. Many renewable energy installations have moved to nearly full reliance of online condition monitoring, thereby making the total expense only the depreciated cost of the monitoring system. The reality of the reliable automatic system is that calendar-based maintenance is nearly eliminated and monitoring intersects at a much lower cost point, as shown in Figure 1.
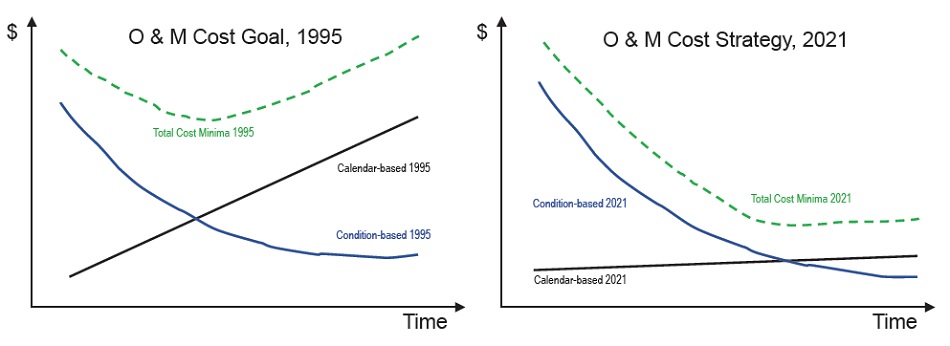
Figure 1. Additive expenses of calendar-based and condition-based maintenance, past & present
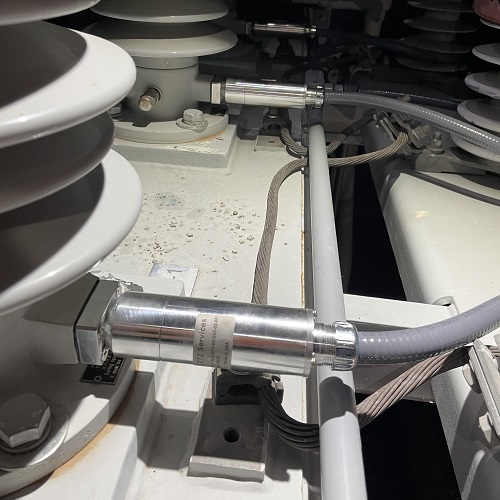
Figure 2. Bushing sensors installed on low-side bushings
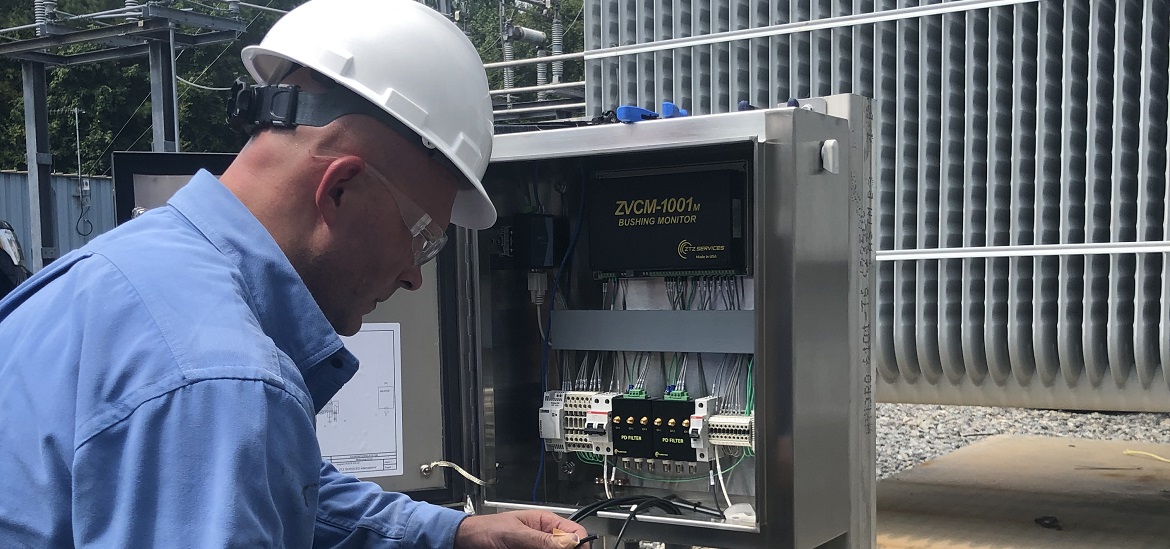
A bushing monitoring system was installed on the main step-up power transformer at a large solar installation in Imperial County, California in May of 2021. For this system, six signals given by the transformer C1 test taps, three voltage signals given by the low-side PTs (Figure 2), and three voltage signals given by the high-side CCVTs were connected to the 12-channel monitoring system (Figure 3).
The use of all twelve phasor measurements makes for an extremely robust system with very high signal-to-noise ratio. By using measured system phasor quantities, the bushing attributes can be very accurately known.
Within a few days, it was quite apparent there was a problem with the H1 high side bushing, with power factor nearing three times nameplate (Figure 4). Phases H2 and H3 showed stable power factor, essentially at nameplate values (Figure 5). Because of the heavy load cycle, this transformer was classified as being applied to "rough service". The high power factor reading put it beyond the limit for any "watch list" but was classified as "unstable", in danger of failure.
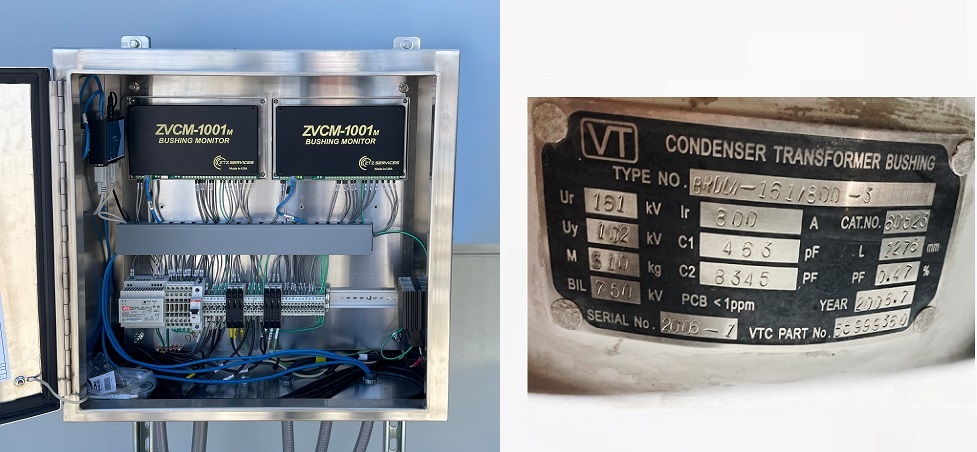
Figure 3. Two six-channel bushing monitors are installed beside the transformer (left). Figure 4. High-side bushing nameplate showing factory test data (right).
With "green" renewable energy selling for a premium locally, the revenue loss while waiting for the replacement transformer would be ten times the value of the transformer itself. With the performance history of over 700 bushing monitors installed within the parent utility, trusting the guidance of the monitor was an easy decision.
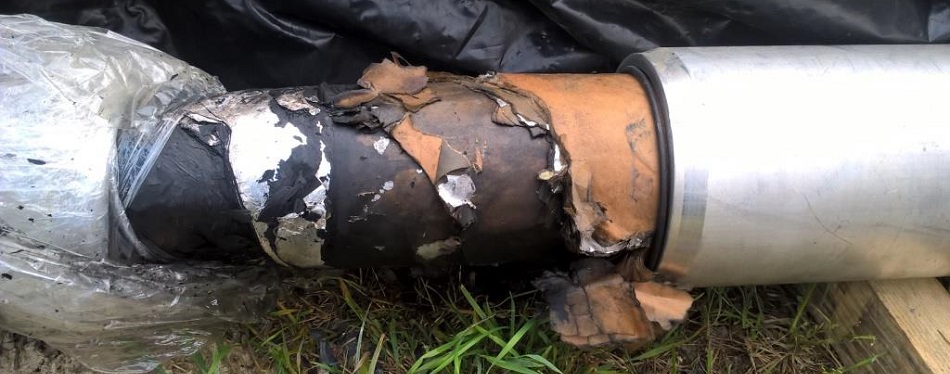
In August, the bushing was tested with offline techniques. The test confirmed the high power factor and the bushing was replaced without incident three weeks later (Figure 6).
Plots of bushing capacitance and high side imbalance current were stable since the monitor installation, showing the likelihood that the H1 bushing had high power factor when the transformer was commissioned, but was not detected with offline test techniques.
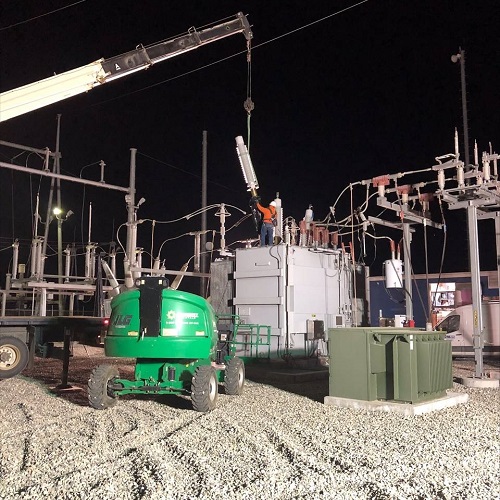
Figure 6. Night time H1 bushing replacement
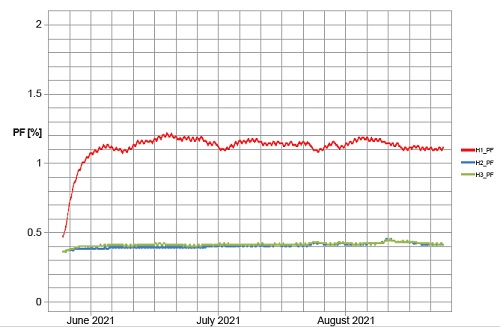
Figure 5. High-side percent power factor for three months since monitor installation
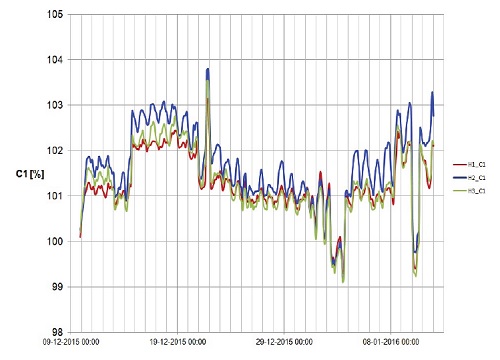
Figure 7. C1 percentage above nominal of high-side bushings, two month plot
At a power plant in Eastern Europe, bushing monitoring was added to the high-side bushings of a 17-year-old 270 MVA GSU in December of 2015. Six phasor inputs were used; three high side C1 test tap connections and three CCVT inputs. Two months after installation, the data showed the C1 from H2 (blue trace) above the others by 0.5% (Figure 7). The power factor data (Figure 8), shows power factor of H2 peaking at 1.5% (red trace).
Further increasing confidence, the polar plot of the high side leakage imbalance current (Figure 9) shows steady increase, showing strong polarization.
Four months from installation, data shows worsening conditions. C1 at 111% (Figure 10), PF at 8% (Figure 11), and leakage current imbalance of 8.0% (Figure 12).
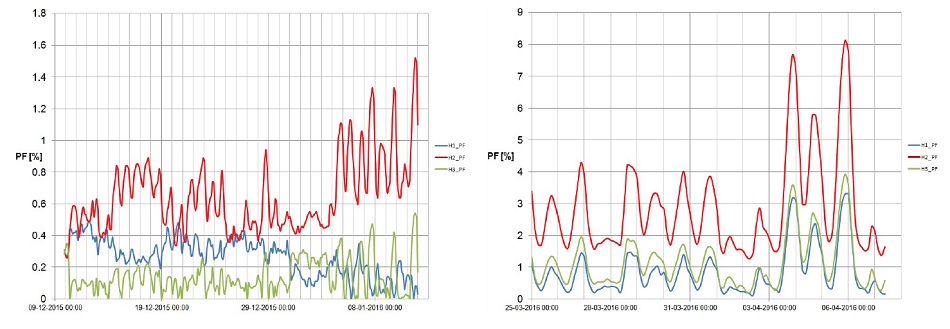
Figure 8. Percent power factor data of high side bushings, two month plot (left). Figure 11. Percent power factor data of high side bushings, four month plot
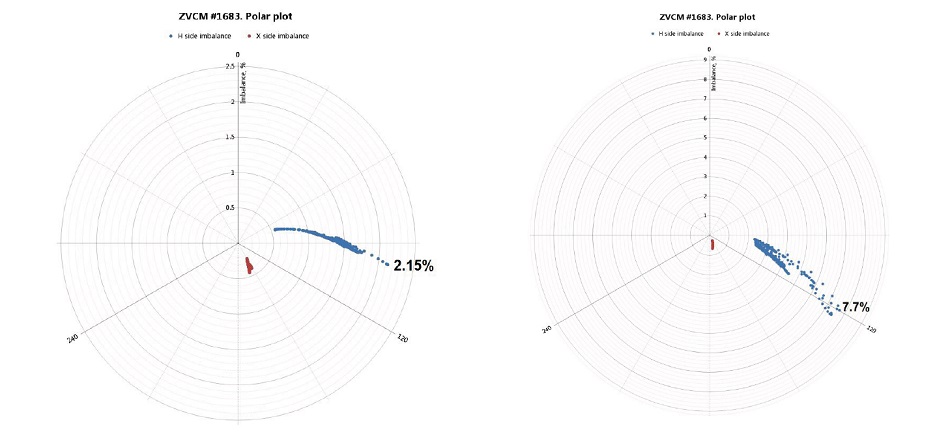
Figure 9. Polar plot of leakage current imbalance, two month plot (left). Figure 12. Polar plot of leakage current imbalance, four month plot (right).
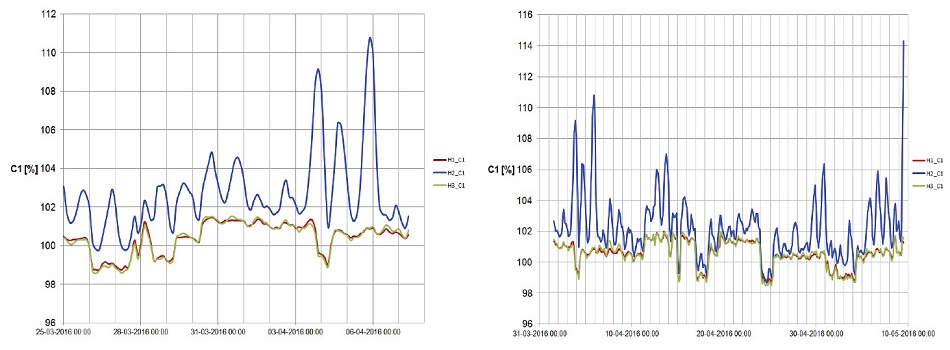
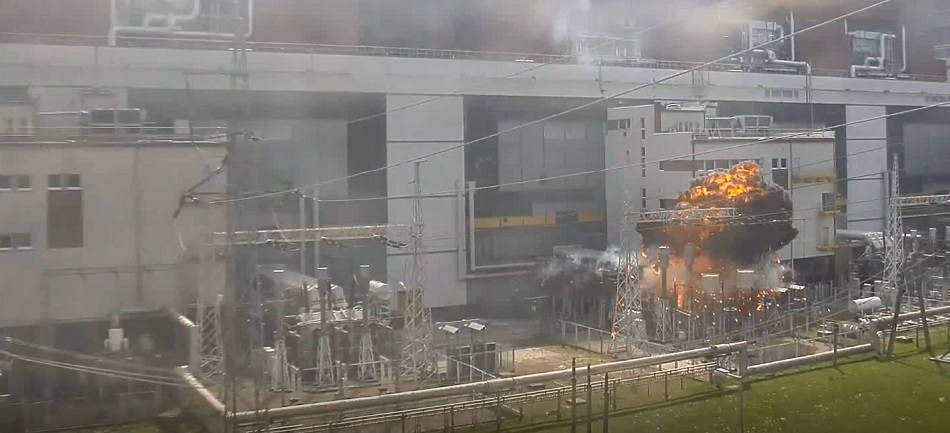
Figure 10. C1 percentage above nominal of high side bushings, four month plot (left). Figure 13. Final death rattle of the H2 bushing, showing last measurement of C1 (right).
In May of 2016, it was advised that the transformer be taken immediately out of service for testing. Because an outage was planned within five weeks, the owner decided to wait until then. Two days before the outage, the bushing exploded (Figure 14). The final C1 measurement of H2 was 114% (Figure 13) and 8% power factor. In the last moment before failure, the big increase of C1 can be observed, caused by break of insulation layers between metal foils in bushing condenser core (Figure 15).
A monitoring system giving asset condition guidance with very high confidence is something that is continually improved over decades in thousands of field installations. Sensors and other hardware are required to be made with high precision and material quality, with no system calibration requirement for the life of the system. Of course, most commercial monitoring systems can be made to work well at time of commissioning, but only the highly developed system, well installed, will last for decades.
The hardware requirements for utility use are different than for consumer electronics. High refinement includes immunity to cyberattack, continuing compatibility as the PC operating system landscape changes, and the continued draw on IT resources for software patches and "updates" made unnecessary.
Improvements applied to algorithms, methods, signal fidelity, and noise rejection give the highest sensitivity to changes and fastest determination of problems. Noise filtering after the measurements are not a panacea. Signal filters with long time constants slow the decision response and hide valuable nuances. Management of external electrical noise must be in the heart of the system, as part of the wholistic design, not as an afterthought.
The end product is reliable supervision of expensive transformer assets which are becoming more and more valuable as replacements have ever longer lead times.
The failure above was only allowed to happen by human interaction. Waiting for the response from a "panel of experts" is no longer required as an arbiter and can be an expensive liability, especially in the case of a rapidly developing problem.
The actual failure event was captured on video, and you can see it here.