









How layered image analysis, multi-sensor correlation, and GeoAI can convert inspection data into consistent maintenance decisions
Power utilities have never lacked inspection data. Field crews, helicopters, drones, fixed sensors, and handheld instruments routinely collect visible camera photographs, thermal images, ultraviolet corona PD findings, and other condition information. The challenge has traditionally begun after the data is collected.
For many years, inspection analysis relied on a largely manual workflow. Images were downloaded into folders, reviewed one by one, compared with field notes, and summarized in reports. Experienced inspectors could identify important findings, but the process was time-consuming and difficult to scale. Results could also vary between inspectors, especially when severity was described qualitatively. Valuable information often remained distributed across spreadsheets, image folders, PDF reports, and separate departmental systems, making it difficult to compare inspections over time or understand patterns across the network.
Artificial intelligence is beginning to change this workflow. Its most immediate benefit is the ability to process large volumes of inspection data faster and more consistently. However, useful AI for grid operations involves much more than placing a box around a defect. A complete inspection-analysis system must understand what equipment is visible, identify possible abnormalities, determine where the abnormality is located on the component, quantify its extent, and place the finding within its operational and geographic context. Only then can the result support maintenance decisions.
A Layered Analysis Process
AI-based inspection analysis can be viewed as a sequence of connected layers. Each layer answers a different question, and errors at an early stage can affect every stage that follows.
The first layer is asset and component recognition: What is shown in the image? A model may need to distinguish a transmission tower from a distribution pole, then identify insulator strings, conductors, connectors, clamps, bushings, surge arresters, or other subcomponents. This is important because the meaning of an anomaly depends on where it appears. A visible mark on an insulator is evaluated differently from the same visual pattern on a metal fitting.
The second layer is anomaly detection: Is anything unusual present? Depending on the sensor, the model may search for corrosion, cracks, missing hardware, contamination, vegetation encroachment, thermal hotspots, corona discharge, or other abnormal signatures. Those systems use segmentation to locate anomaly findings with bounding boxes to identify the precise pixels associated with a defect.
The third layer is characterization. Detecting an anomaly is not enough; the system must describe it. Relevant characteristics may include the size and location of a crack, the temperature difference of a hotspot, the spatial distribution and persistence of UV discharge activity, the percentage of a component affected by corrosion, or the distance between vegetation and an energized conductor. This layer converts a visual indication into measurable information.
The final layer is condition and severity assessment. Severity may depend on the type of defect, its extent, the material and function of the affected component, its location on the component, evidence from previous inspections, and the presence of supporting findings from other sensors. Operational parameters also matter. The same physical defect can carry different urgency depending on asset criticality, network redundancy, loading, environmental exposure, accessibility, customer impact, and the consequences of failure. Structured assessment frameworks, including the EPRI field inspection guidance, can help translate this evidence into consistent condition levels and recommended actions.
For this reason, severity assessment is often best implemented as a hybrid process. AI can detect and quantify evidence, while engineering rules, industry guidance, asset data, and expert review determine how that evidence should be interpreted. This is more reliable than expecting a single model to move directly from pixels to a maintenance decision without showing the reasoning behind it.
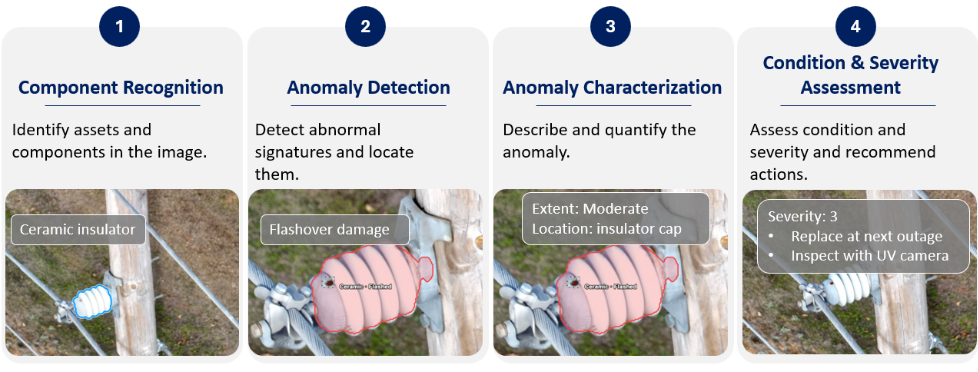
A layered AI workflow: from component recognition and anomaly detection to characterization, condition assessment, and recommended maintenance action.
How the Models Work
Most image-analysis systems used for inspection rely on deep neural networks. These models learn visual patterns from labeled examples rather than from manually programmed image rules. During training, the network processes large numbers of images in which components and defects have been identified by subject matter experts with relevant technical knowledge. The model adjusts its internal parameters until it can reproduce those labels on new images.
Convolutional neural networks have been widely used because they are effective at learning shapes, textures, edges, and spatial patterns. Object-detection architectures such as YOLO process an image and predict object categories and locations in a single pass, making them useful when rapid analysis is required. Segmentation networks provide more detailed boundaries, which can be valuable when the extent of corrosion, contamination, vegetation, or damaged material must be measured. Vision-transformer-based models are also increasingly used because they can capture relationships across larger regions of an image, although their performance still depends heavily on training data, computing resources, and the application.
In practice, no model family is universally best. A fast detector may be appropriate for screening thousands of drone images, while a segmentation model may be needed for detailed component-level analysis.
Video analysis introduces additional requirements, including tracking components and findings across consecutive frames and distinguishing persistent events from brief noise, reflections, camera motion, or other transient effects. This typically requires temporal analysis techniques such as object tracking, frame-to-frame association, and persistence filtering.
Why Grid Inspection AI Is Difficult
Developing AI for grid inspections is significantly more difficult than demonstrating a model on a controlled image set. Power networks contain a wide variety of equipment from different manufacturers, installation periods, voltage classes, material types, and geographical regions. Even components with the same function can differ in geometry, color, aging pattern, and mounting configuration.
The inspection environment adds further variability. Backgrounds may include sky, vegetation, gravel, buildings, other structures, or complex substation equipment. Lighting changes by time of day and season. Rain, fog, dust, salt contamination, shadows, reflections, and motion blur can alter the appearance of both the component and the anomaly.
Capture geometry is another major challenge. Drone imagery may be collected from above, below, or at an oblique angle, with changing distance and resolution. Handheld inspections are often performed from the ground and may include strong perspective distortion or partial obstruction. Fixed cameras repeatedly observe the same area but may experience vibration, changing weather, or gradual changes in the scene. A model trained mainly on close-range handheld images may perform poorly on aerial images of the same component.
This difference between training data and real operating data is known as domain shift. It is one of the main reasons a model that performs well in a laboratory or pilot project may not generalize immediately to another utility. Successful deployment requires a dataset that represents the utility’s actual equipment, environments, sensors, and inspection methods. It also requires ongoing validation after deployment, because network conditions and data-collection practices change over time.
Defect data presents an additional problem: serious faults are relatively rare. Utilities may have millions of normal-component images but only a small number of confirmed examples for a particular failure mode. Training data must therefore be carefully selected, reviewed, and balanced. Synthetic data and data augmentation can help, but they do not eliminate the need for real, technically validated examples.
AI models typically produce both a prediction and a confidence score indicating how strongly the model supports that prediction. The confidence threshold determines which predictions are reported as findings. A lower threshold generally increases sensitivity and identifies more potential anomalies, but it may also produce more false positives. A higher threshold reduces false positives, but it may also increase the risk of missing genuine anomalies. Selecting the appropriate threshold is therefore an important part of model validation and should reflect the inspection objective, defect type, data quality, and consequences of a missed finding.
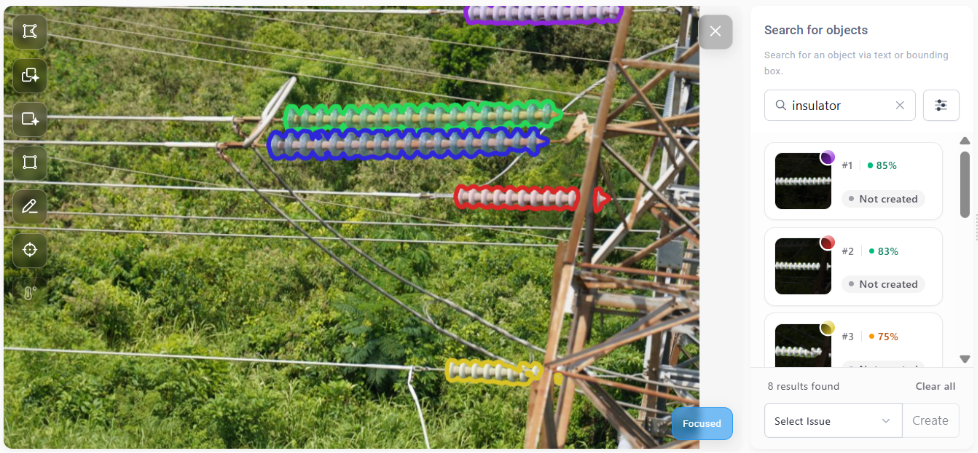
Component recognition in Gridnostic, demonstrating the model’s ability to identify grid components, generate precise segmentation masks and bounding boxes, and assign a confidence score to each detection. The confidence threshold can be adjusted by the user.
From Single-Sensor Detection to Multi-Sensor Understanding
Grid inspections increasingly combine RGB, thermal, ultraviolet, and other sensing technologies. Each modality reveals a different physical process. RGB imagery documents visible condition. Thermal imaging identifies abnormal heating. Ultraviolet imaging detects corona partial discharge activity associated with electric-field stress.
AI can analyze each modality separately, but greater value is created when the findings are correlated. A suspected defect may receive higher confidence when visible damage, abnormal heating, and discharge activity occur on the same component. Conversely, an isolated indication may require additional review before maintenance is initiated. Multi-sensor fusion can therefore improve confidence, reduce unnecessary interventions, and provide a more complete description of asset condition.
GeoAI: Adding Network and Environmental Context
A defect exists at a physical location within an interconnected system. Geospatial artificial intelligence, or GeoAI, combines AI-generated findings with geographic information systems, asset registries, network topology, environmental data, and inspection history.
At the simplest level, geospatial integration ensures that every image and finding is connected to the correct pole, tower, line segment, or substation component. This is essential for creating work orders, dispatching crews, comparing repeated inspections, and maintaining traceability.
At a more advanced level, GeoAI can identify patterns across the network. Clusters of corona activity in a coastal area may indicate salt-related contamination. Repeated thermal anomalies on heavily loaded line sections may point to a broader operational issue. Vegetation findings can be analyzed in relation to growth rates, terrain, weather, access routes, and fire-risk zones. The system is no longer asking only, “What is wrong with this asset?” It is also asking, “Why is this occurring here, what other assets may be exposed, and what is the system-level consequence?”
Geospatial context also supports prioritization. A moderate defect on a critical corridor with limited redundancy may require faster action than a more visually severe defect on an asset with lower operational impact. By combining condition evidence with location, topology, and consequence data, utilities can move from defect lists toward risk-informed maintenance planning.
Keeping People in the Decision Loop
AI should reduce repetitive review, not remove engineering accountability. Inspectors and asset experts remain essential for validating unusual findings, resolving uncertain cases, updating diagnostic rules, and confirming that recommendations make sense under real operating conditions.
A practical system should therefore show the evidence behind its output: the component identified, the region considered abnormal, the measurements used, related sensor findings, historical comparisons, and the factors that influenced severity. Confidence scores can help, but they should not be treated as substitutes for technical explanation.
Data governance is equally important. Images must be consistently associated with asset identifiers, timestamps, coordinates, sensor settings, environmental conditions, and inspection methods. Standardized data structures make results traceable and interoperable with GIS, enterprise asset management, work-management, and regulatory systems. For transmission-line programs, IEEE 1808-2024 (IEEE Guide for Collecting and Managing Transmission Line Inspection and Maintenance Data) provides a useful framework for collecting and managing inspection and maintenance data. Without reliable metadata, even a strong AI model produces information that is difficult to use operationally.
The Path Forward
The near-term role of AI in grid inspections is not autonomous decision-making. It is disciplined decision support: organizing inspection data, screening large datasets, detecting and quantifying abnormalities, correlating multiple sensors, and presenting engineers with consistent evidence.
As datasets mature, models will increasingly support trend analysis and prediction. Edge computing may enable initial screening directly on drones, robots, handheld instruments, or fixed monitoring systems. GeoAI may reveal network-wide patterns that are not visible in individual reports. Predictive models may estimate where degradation is accumulating and which assets require closer attention.
The value of these capabilities will depend less on the novelty of the algorithm than on the quality of the complete workflow. Reliable AI requires representative data, technically correct labels, standardized collection, transparent severity logic, integration with utility systems, and continuous validation by experts.
Used in this way, AI can transform inspection data from a collection of isolated images into structured operational intelligence. The objective is not simply to find more defects. It is to understand them earlier, evaluate them more consistently, place them in the context of the grid, and help utilities direct limited maintenance resources where they can have the greatest impact.

Sheyna Reizes is Vice President of Product at OFIL Systems.
She holds a B.Sc. in Mechanical Engineering and an MBA. Shyna has extensive experience in B2B product management across multiple industries, with a focus on multidisciplinary hardware systems and data-driven software platforms. In her role at OFIL Systems, she defines product strategy, aligns advanced inspection technologies with market requirements, and supports the development and deployment of solutions based on real customer and industry needs, working closely with cross-functional teams including R&D, sales, and marketing.

This article was originally published in the October 2026 issue of the Next-Gen Infrastructure & the Digital Grid magazine.
View Magazine